This topic contains a solution. Click here to go to the answer
|
|
|

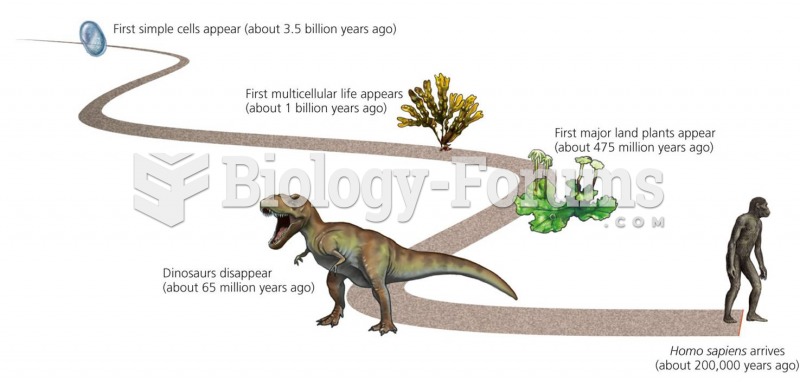 The span of Homo sapiens sapiens’ time on earth
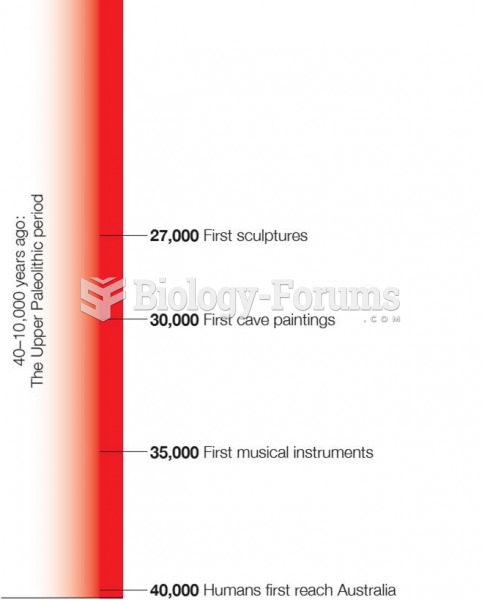 Time Line of Human History From Upper Paleolithic Period to the Present
 Don Gray, Stone #2, from the series Nine Stones.
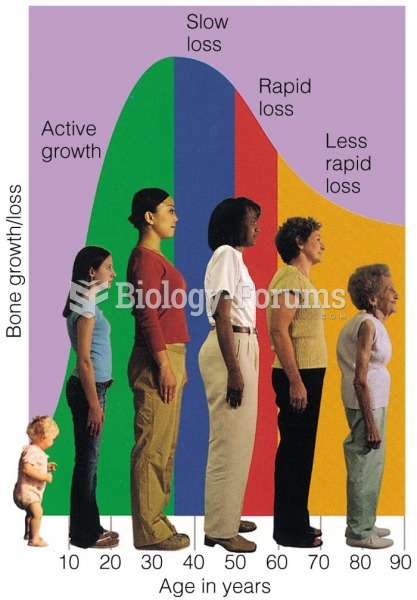 Change in Bone Mass over Time In your early years, more bone mass is added than lost in your body
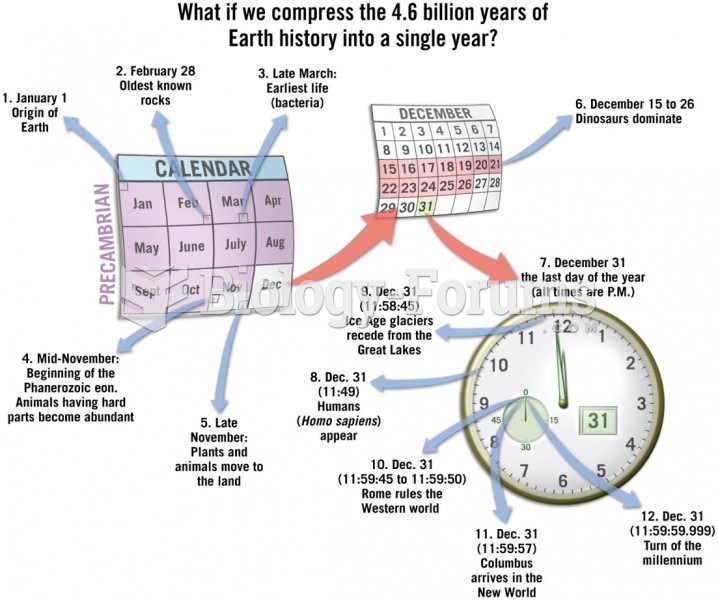 Magnitude of Geologic Time
 Use the graph of the function f(x) to answer each question.