This topic contains a solution. Click here to go to the answer
|
|
|

 Thoracic Expansion, Anterior
 Hydrocephalus. The figure on the left is a child with the enlarged ventricles of hydrocephalus. The
 Primary pulse points of the body.
 Use of the elbow to apply pressure to trigger points in the trapezius with the receiver in sitting ...
 Spectrum of Food Security Food insecurity and hunger are points along the continuum
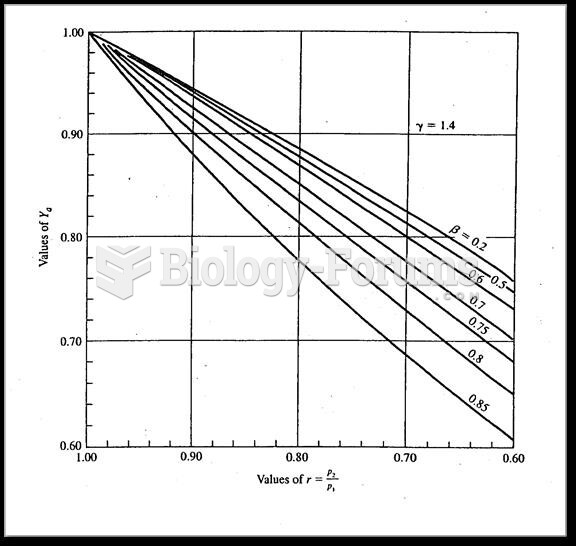 Expansion factors for venturi flowmeters