This topic contains a solution. Click here to go to the answer
|
|
|

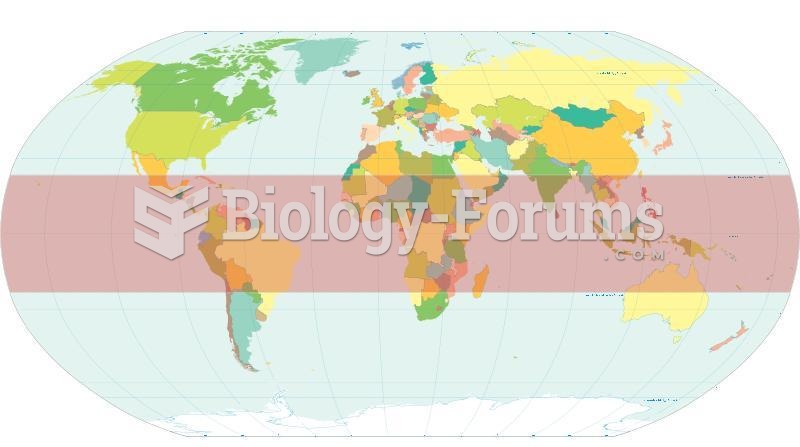 Humanmade pollutants may be driving the expansion of the Earth’s tropical belt seen
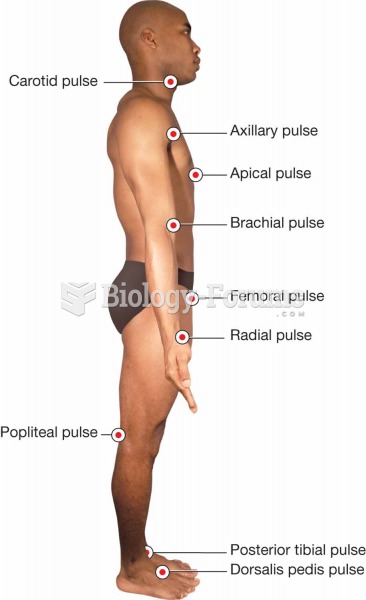 Pulse points.
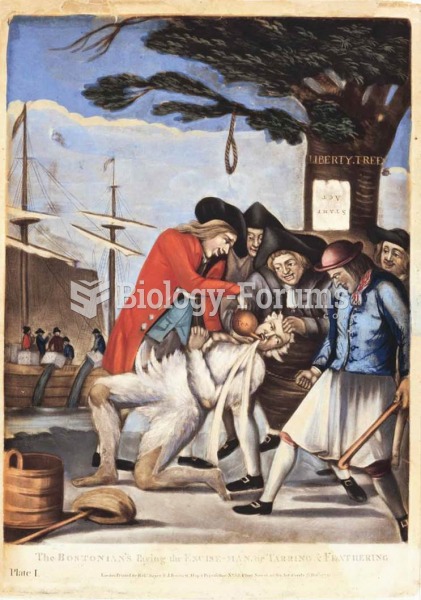 A noose hanging from a “Liberty Tree” reveals this artist’s bias: The “tar-and-feathering” of a Brit
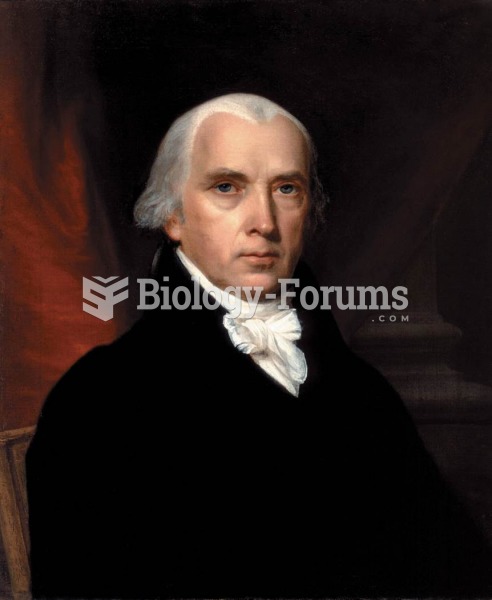 James Madison was a key figure at the Constitutional Convention of 1787 in Philadelphia. He not only
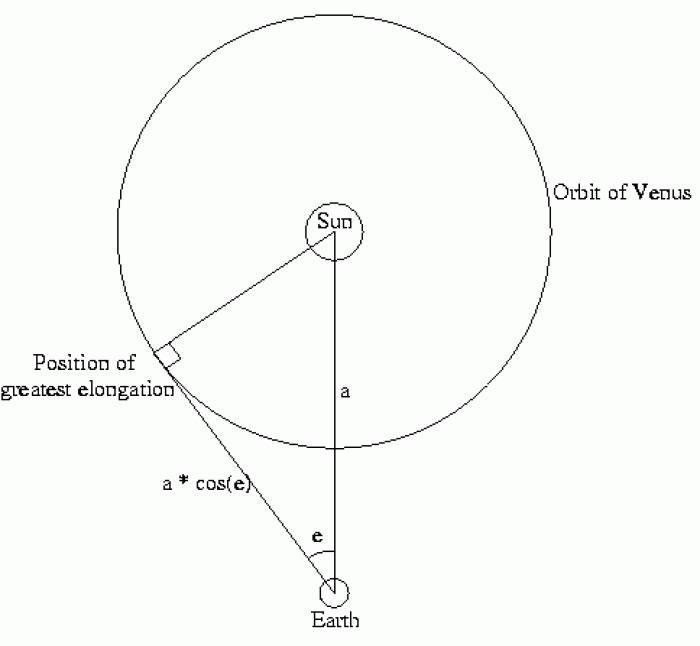 Distance from Earth to Sun schematic
 Water (Its Volume Expansion Upon Freezing)