This topic contains a solution. Click here to go to the answer
|
|
|

 Spinnbarkeit is the ability of cervical mucus to stretch a distance before breaking.
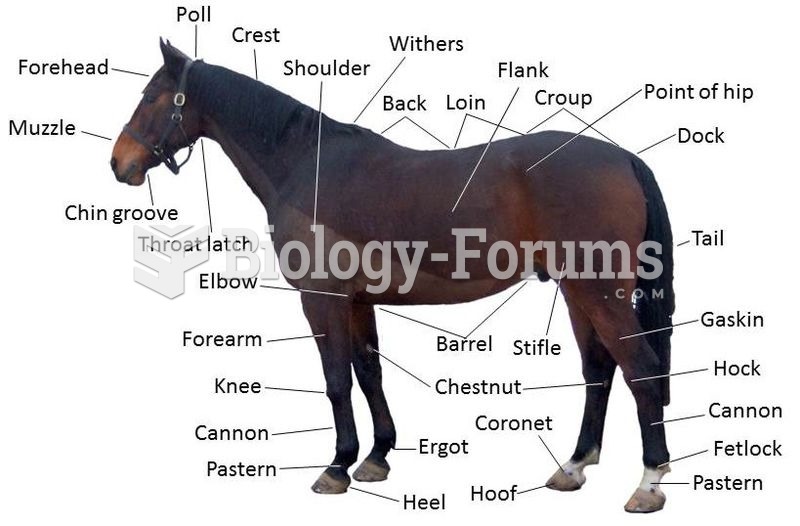 Points of a horse
 Apply direct pressure to points on low back. Press into paraspinal muscles from the side. Move spot ...
 Mobilize knuckles with figure-8s. Turn the hand so palm faces the table. Grasp the proximal phalange ...
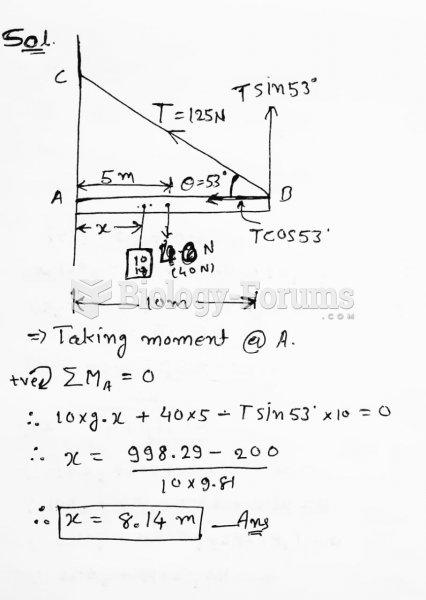 In the figure, a 10.0-m long bar is attached by a frictionless hinge to a wall and held ...
 As shown in the figure, a large open tank contains a layer of oil ( density 450 kg/m3) floating ...