|
|
|

 The paleoanthropologist must understand these deformations in order to figure out which strata a fos
 Demonstrate the Application of Triangular, Figure-Eight, and Tubular Bandages
 For millions of people, the United States represents a land of opportunity and freedom from ...
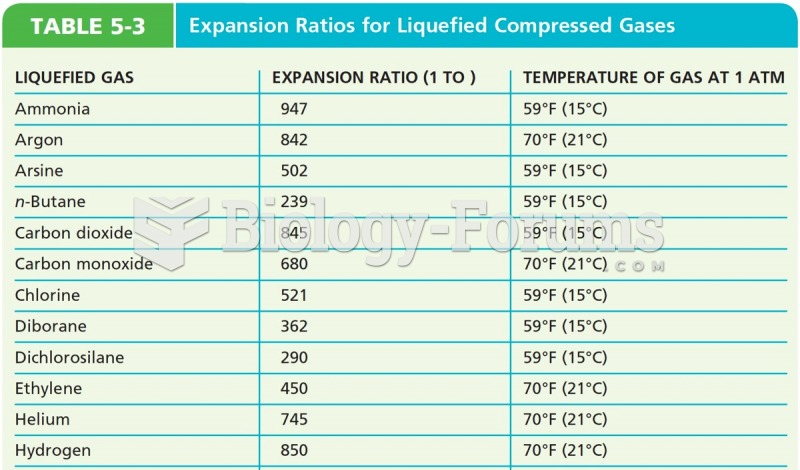 Expansion Ratios for Liquefied Compressed Gases
 What is the current in Figure 16-1(b) if the diode is made of silicon and the polarity of the ...
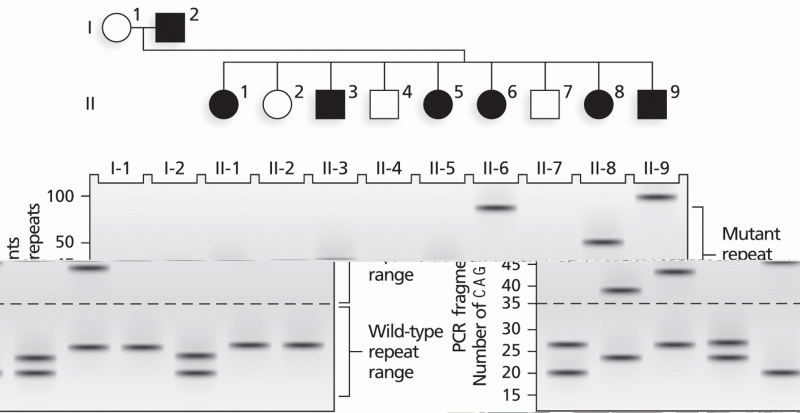 PCR analysis showing expansion of the CAG repeat region of the HD gene