|
|
|

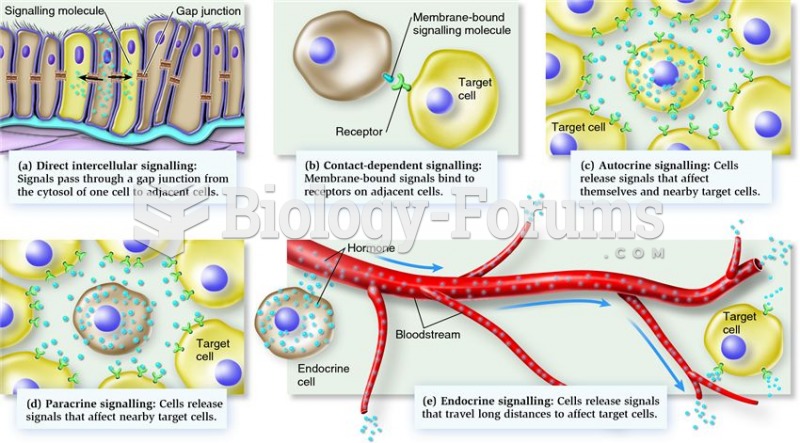 Examples of cell-to-cell communication based on the distance between cells
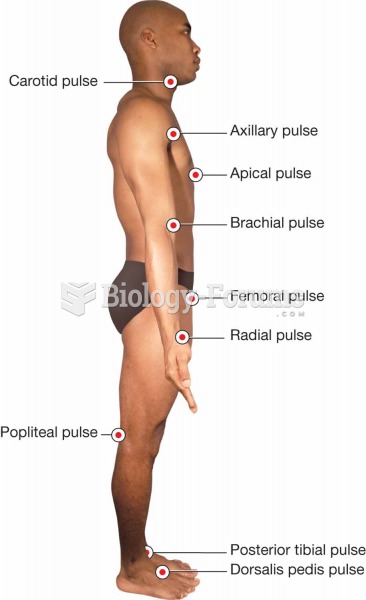 Pulse points.
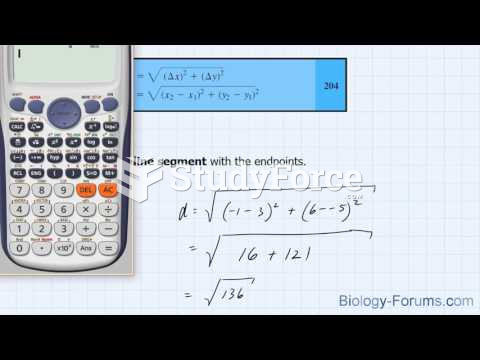 How to find the distance of any line segment
 Apply vibration clockwise around abdomen with fingertips to points in a circle over the colon.
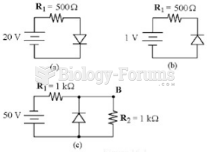 What is the current in Figure 16-1(b) if the diode is made of silicon and the polarity of the ...
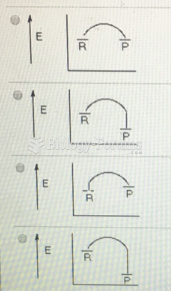 Which of the following represents a reaction coordinate diagram for a chemical reaction whose ...