|
|
|

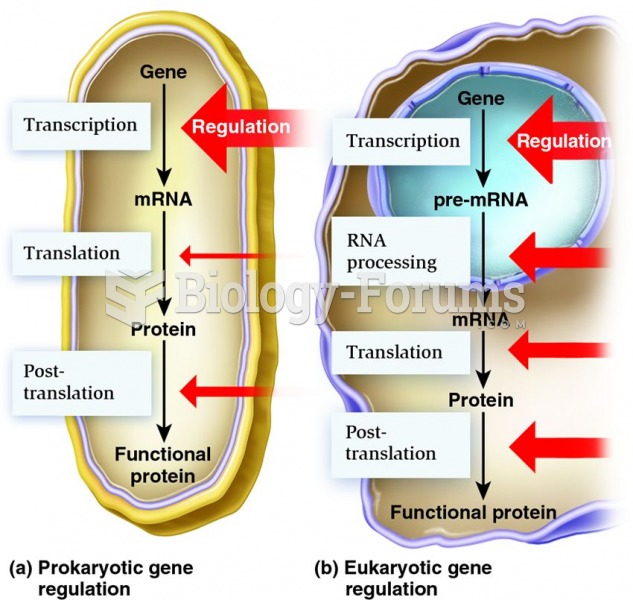 Overview of points of control for gene regulation in (a) prokaryotes and (b) eukaryotes
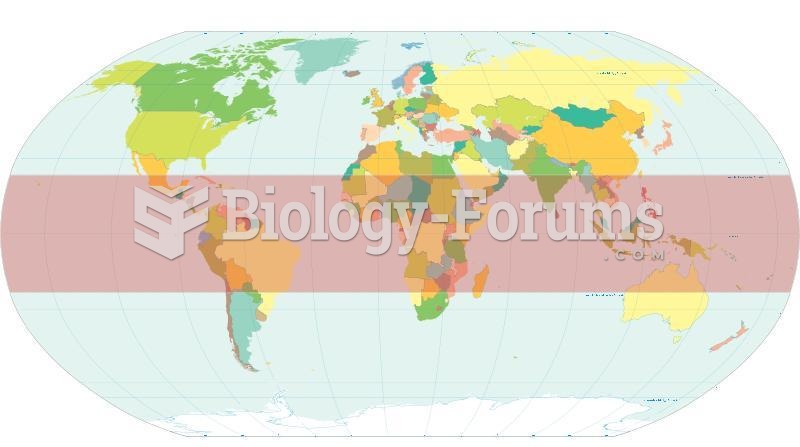 Humanmade pollutants may be driving the expansion of the Earth’s tropical belt seen
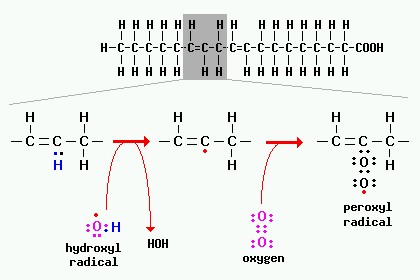 A peroxidation reaction involving a fatty acid is depicted in the figure below.
 How to determine if a table of values represents a function
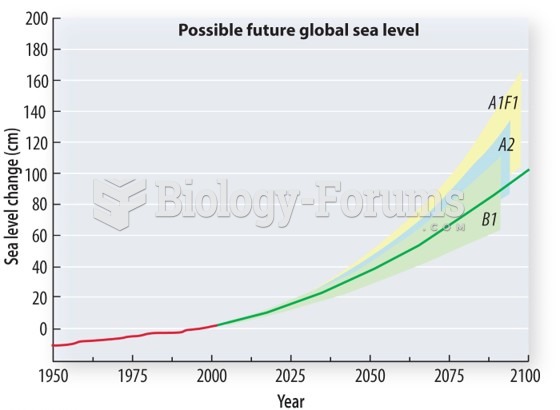 The effect of thermal expansion
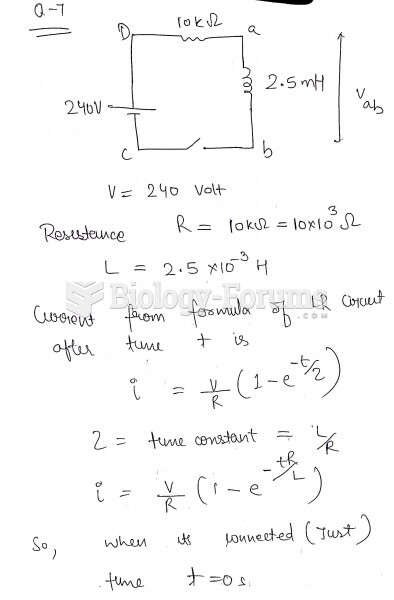 The figure shows an LR circuit with a switch and a 240-volt battery. At the instant the switch ...