|
|
|

 C. Wright Mills (1916-1962) was a controversial figure in sociology because of his analysis of the ...
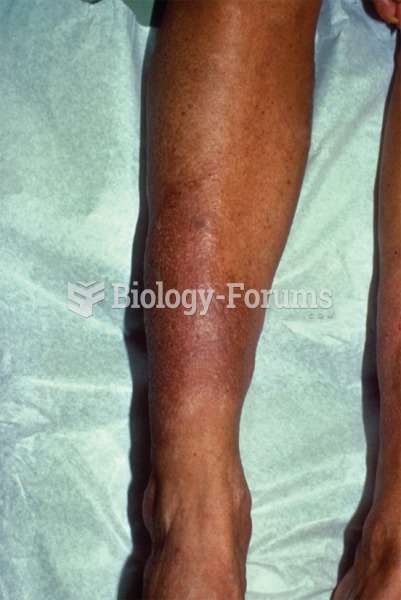 Dermatological changes with myxedema can occur behind the eyes or in the lower leg, as shown here.
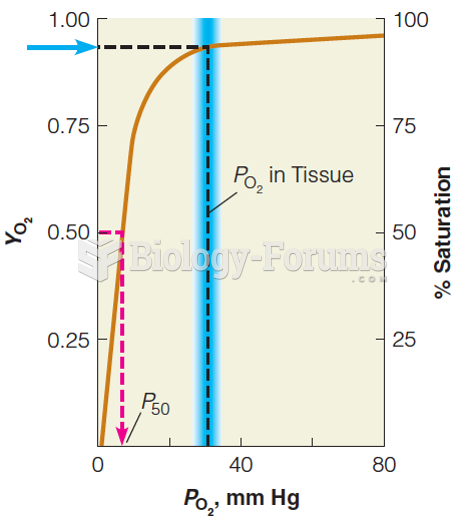 Oxygen-binding curve for myoglobin
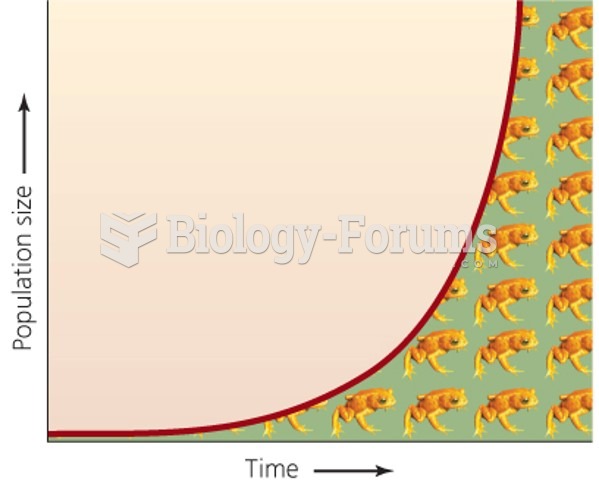 Unregulated populations "J-shaped curve"
 What is the total resistance of the circuit in Figure 1? 150
 Lod Score Values for the Families in Figure 5.15