|
|
|

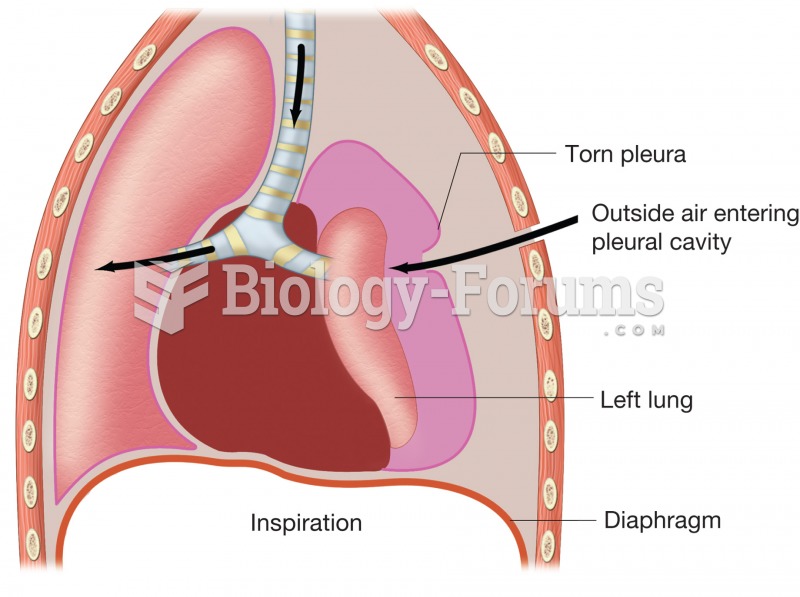 Pneumothorax. Figure illustrates how puncture of thoracic wall and tearing of pleural membrane allow
 Where Earthquakes Occur— Convergent Boundaries
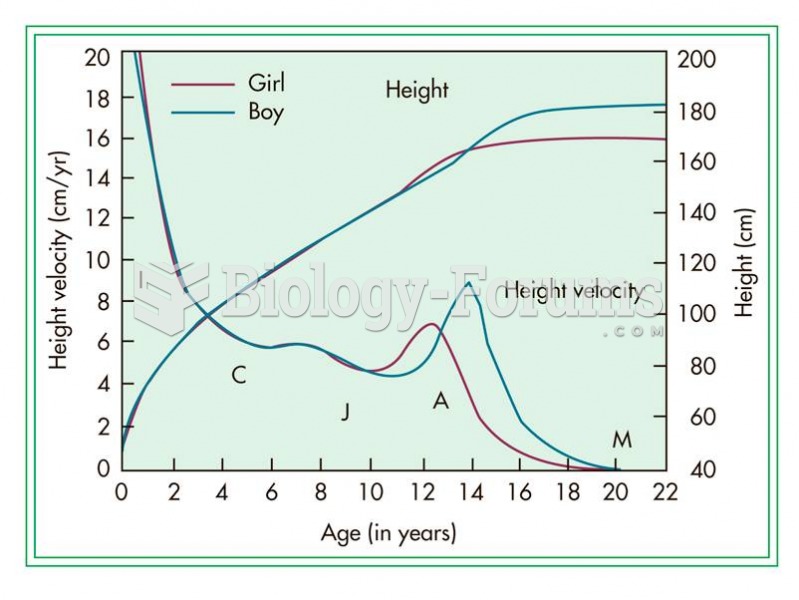 The adolescent growth spurt in humans is seen as a “bump” in the height curve and a “spike” in the h
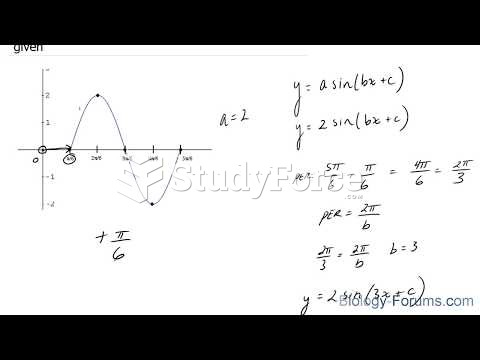 How to create a sine equation when the curve is given
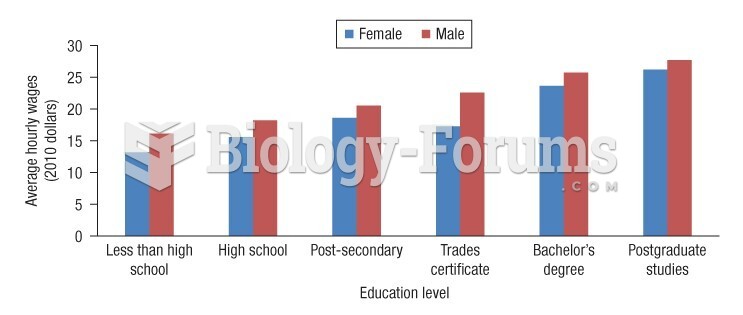 Average real hourly wages (2010 dollars) by education level, full-time workers aged 17 to 34 in 2011
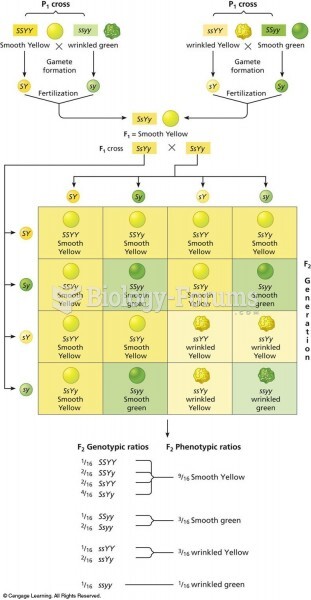 Punnett square of the dihybrid cross shown in Figure 3.8. There are two combinations of dominant and