|
|
|

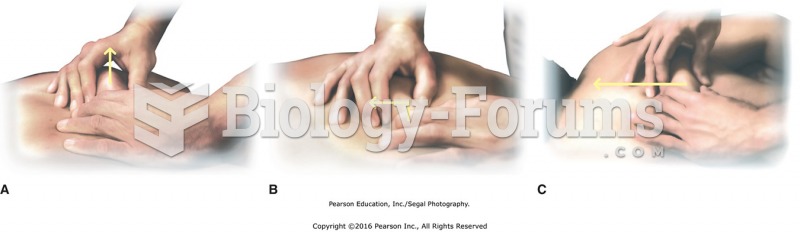 Skin lifting techniques. (A) Basic skin lifting. (B) Lifting with directional shift. (C) Skin ...
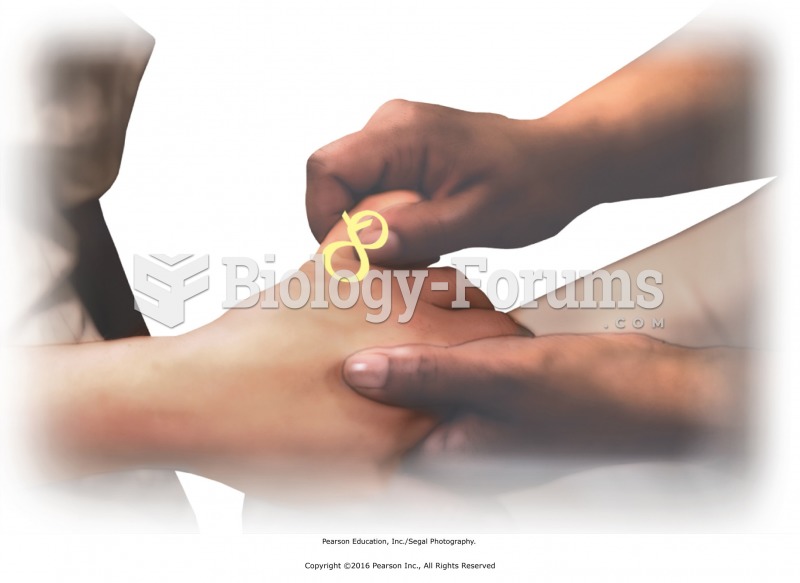 Joint movement of the fingers. Apply scissoring at the knuckles and figure-8s to the fingers to ...
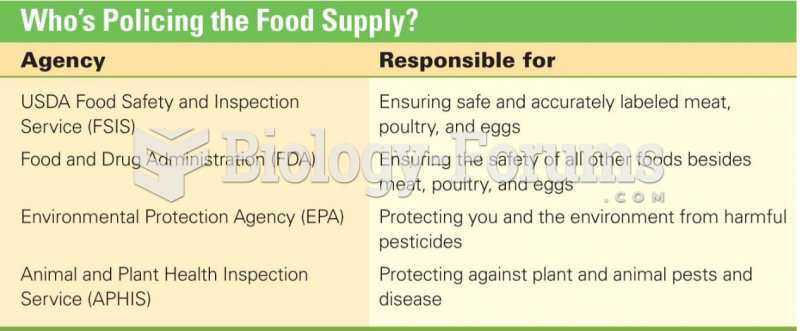 Who's Policing the Food Supply?
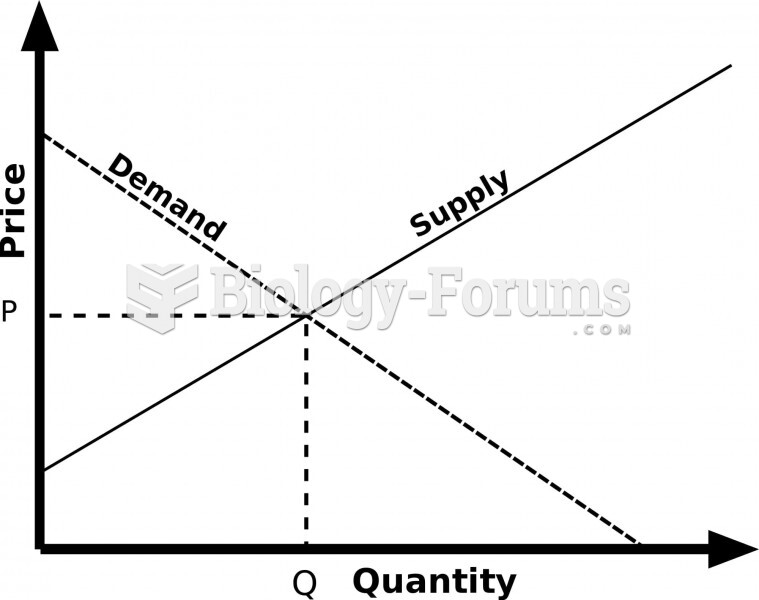 The original Supply and Demand graph
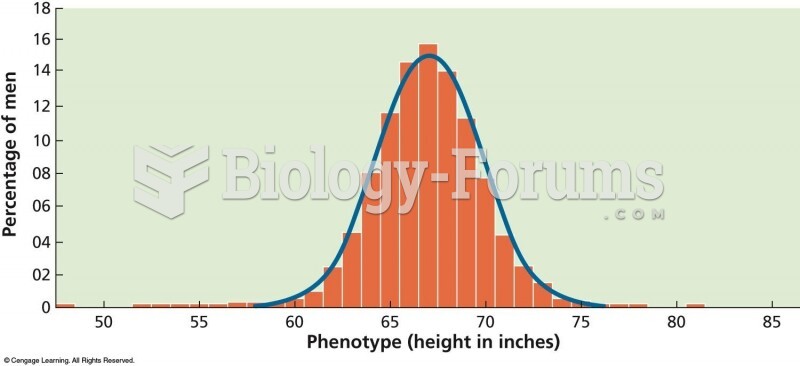 A bell-shaped, or “normal,” curve shows the distribution of phenotypes for traits controlled by ...
 Construct a Lorenz curve that shows income distribution in this society.