|
|
|

Did you know?
Methicillin-resistant Staphylococcus aureus or MRSA was discovered in 1961 in the United Kingdom. It if often referred to as a superbug. MRSA infections cause more deaths in the United States every year than AIDS.

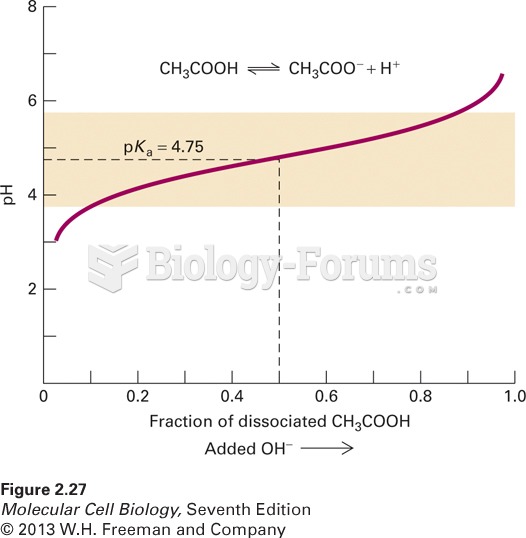 The titration curve of the buffer acetic acid (CH3COOH)
 Rates of Childhood Overweight and Obesity Worldwide The highest rates occur in the most affluent re
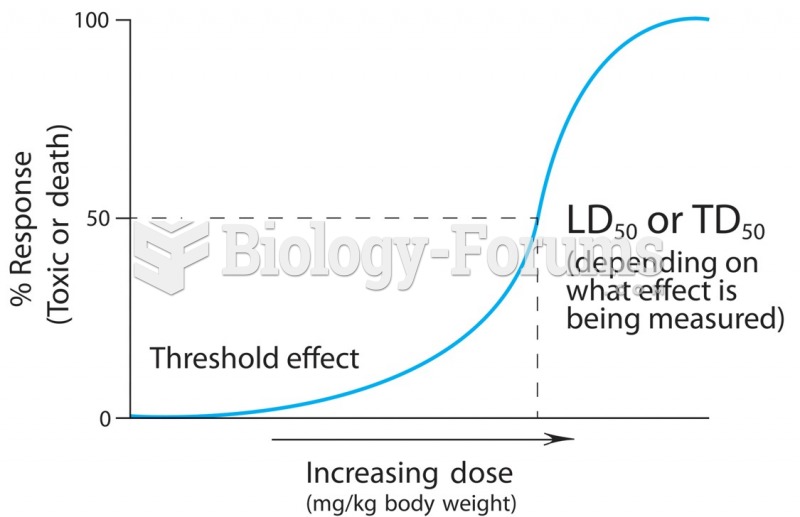 A dose-response curve describes the relationship between the quantity of the chemical entering the ...
 An Environmental Kuznets Curve
 How much voltage does the resistor drop in Figure 10-2? a. 59 mV b. 19.94 V c. 20 V d. 10 V
 Swimming Pool (Figure 3.1)