|
|
|

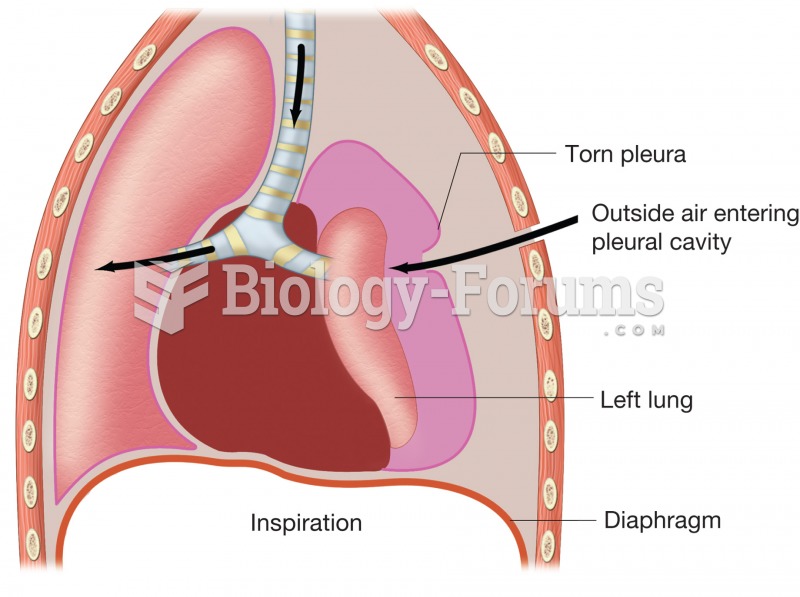 Pneumothorax. Figure illustrates how puncture of thoracic wall and tearing of pleural membrane allow
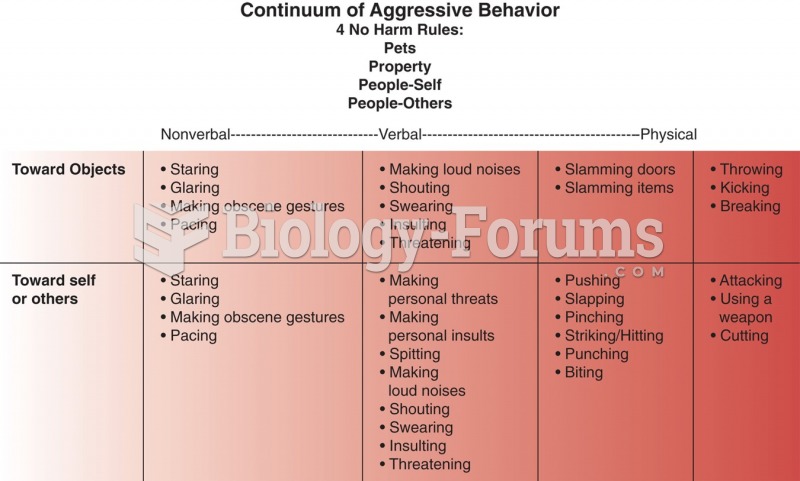 Continuum of aggression. Based on an unpublished figure by Joanne DeSanto Iennaco.
 Mobilize hand and wrist joints. Apply scissoring to knuckles and figure-8s to fingers. Holding the ...
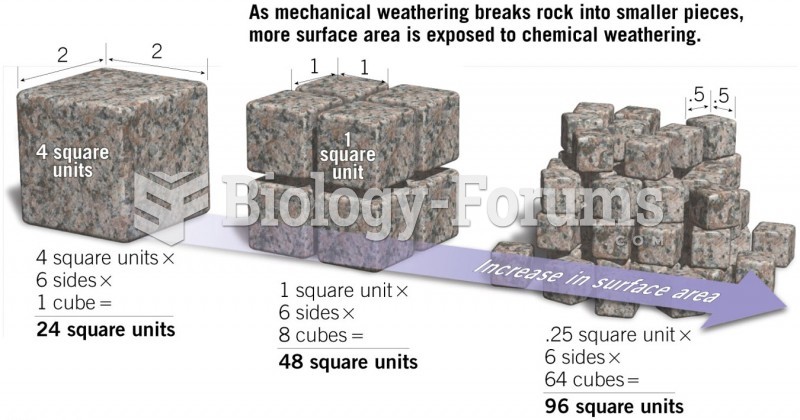 Increase in Surface Area by Mechanical Weathering
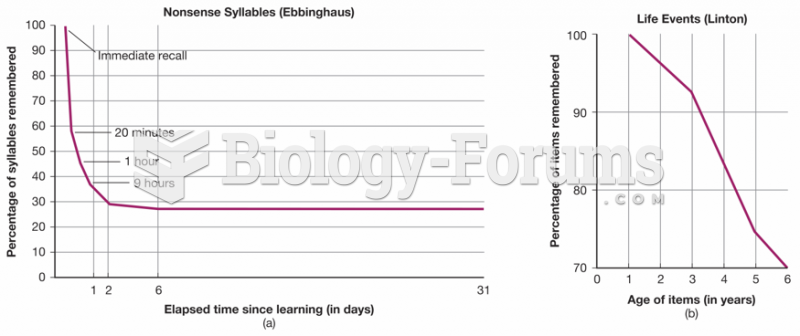 Two Kinds of Forgetting Curves
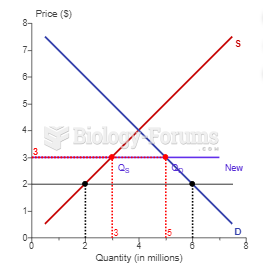 Suppose a country imports televisions. The country's supply and demand curves are shown in ...