|
|
|

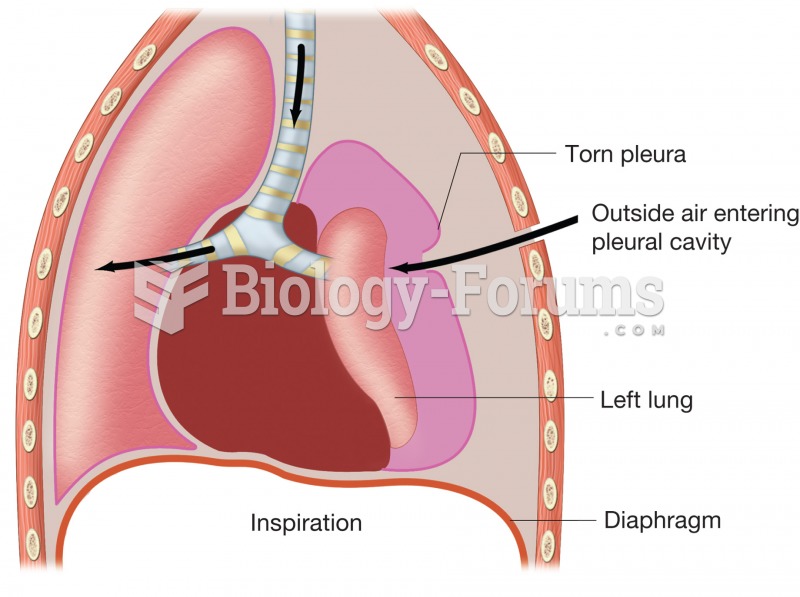 Pneumothorax. Figure illustrates how puncture of thoracic wall and tearing of pleural membrane allow
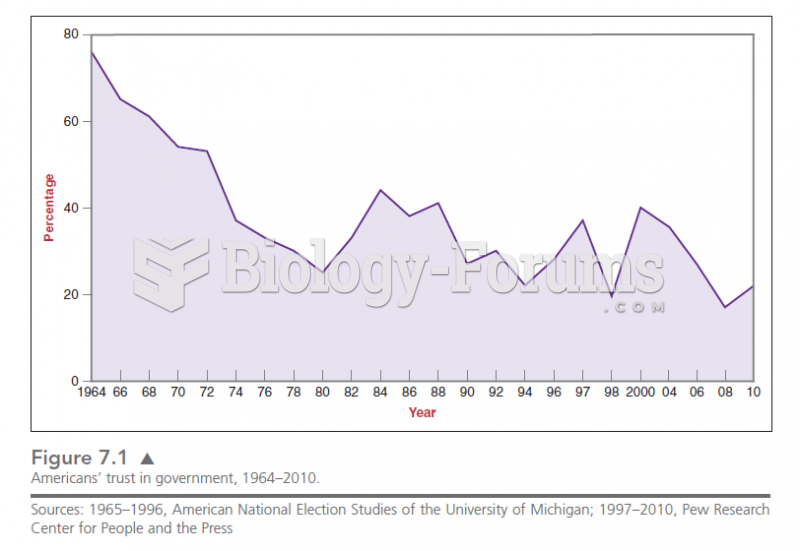 Figure 7.1 shows the rapid decline in the trust of Americans in government since the 1960s. This de
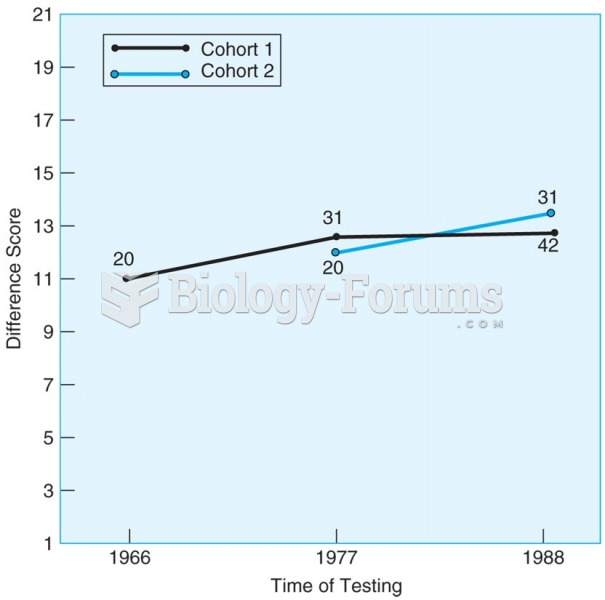 Mean scores for Erikson’s stage VI (Intimacy) for two cohorts. Scores for both cohorts increase ...
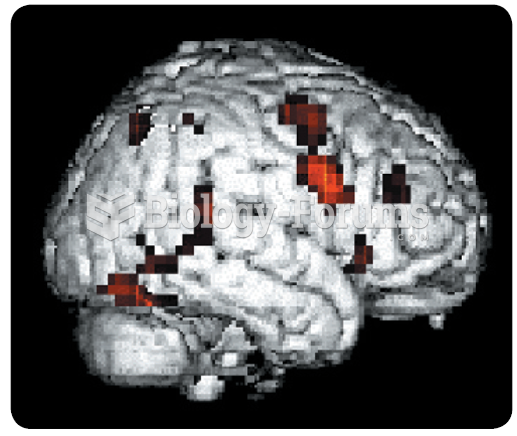 Functional magnetic resonance image (fMRI). This image illustrates the areas of cortex that became ...
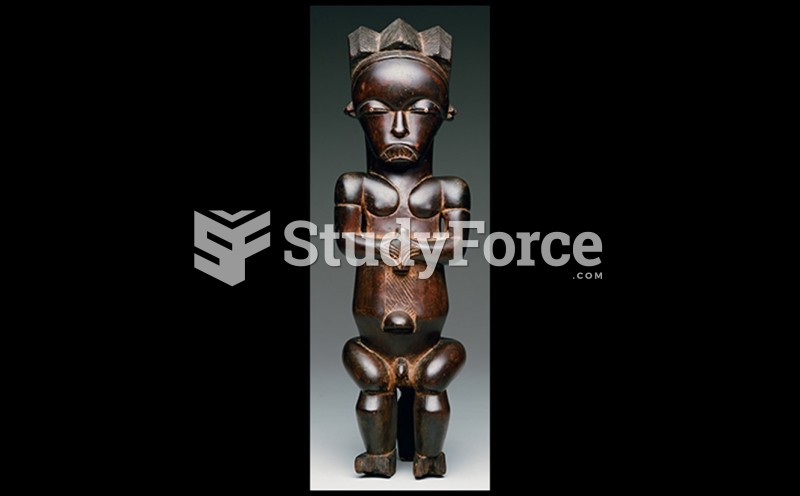 EYEMA-O-BYERI (Reliquary Figure)
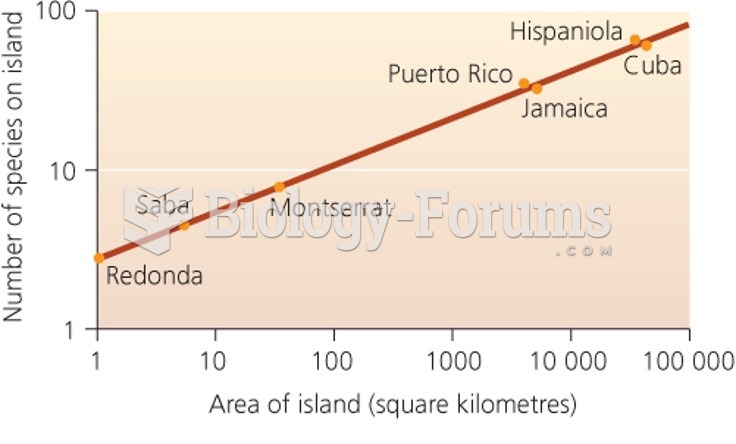 Species-area curves