|
|
|

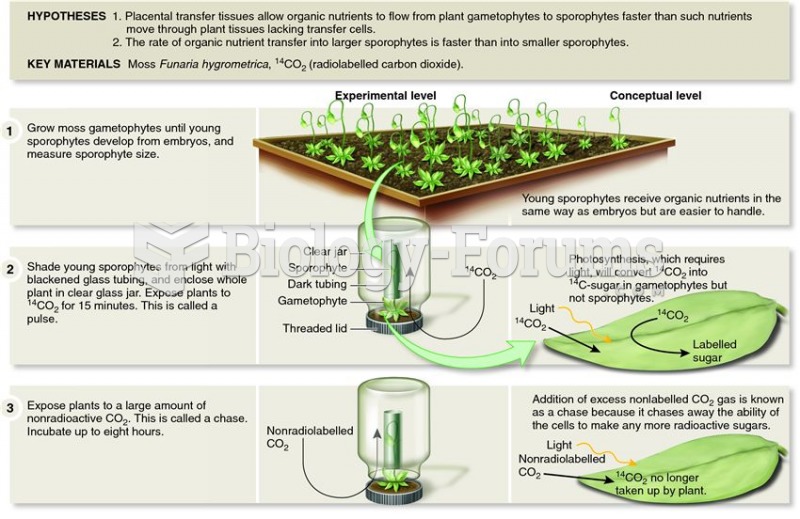 Browning and Gunning demonstrated that placental transfer tissues increase plant reproductive succes
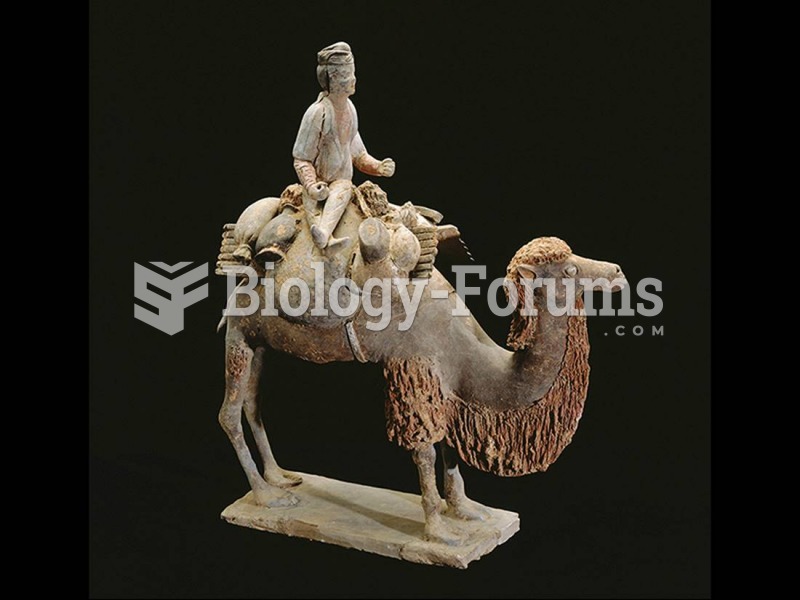 Caravaneer on a camel, China. Tang dynasty, (618–907). Polychrome terra-cotta figure.
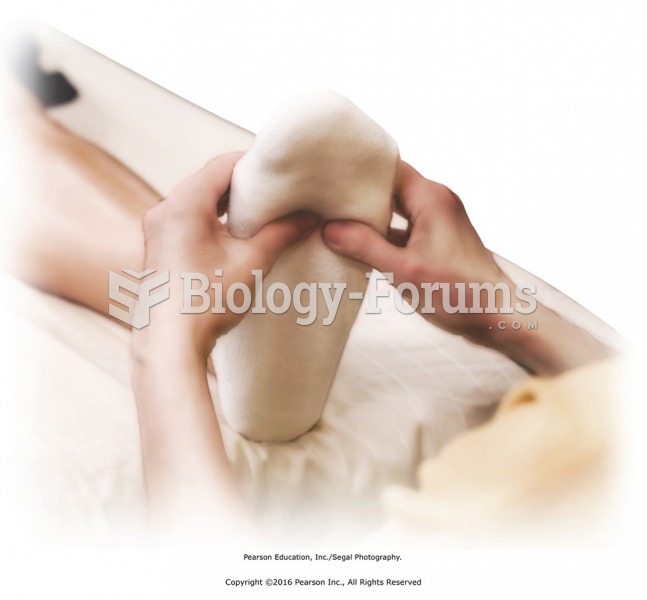 Apply scissoring between metatarsals and figure-8s on toe joints to mobilize the foot.
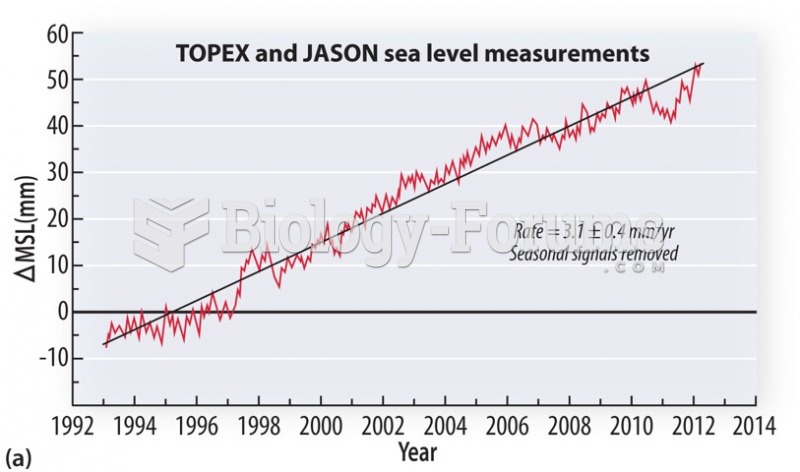 Increase in rainfall on continents
 The growing demand for electrical power, carbon sequestration and storage must be a priority
 Who's Policing the Food Supply?