|
|
|

 Myopia (nearsightedness). In the uncorrected top figure, the image comes into focus in front of the
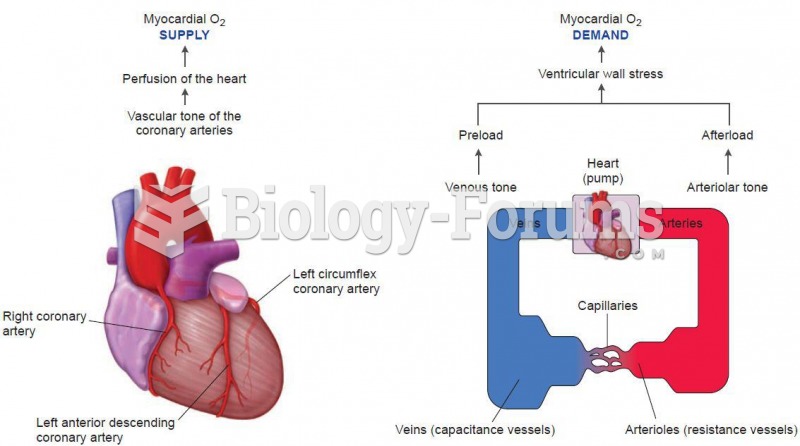 Myocardial Oxygen supply and demand
 Maps are important tools in political science as they help us see relationships between politics and
 A car wash reduced the price of a basic wash as a promotion and test of the market. With the ...
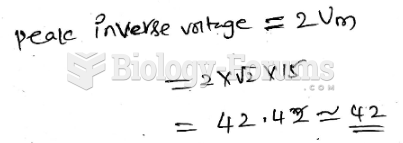 For the circuit in Figure 1, assume ideal diodes. The peak inverse voltage is approximately
 Cost = $99.49; Rate of markup based on cost = 32%. Find the markup and selling price.