|
|
|

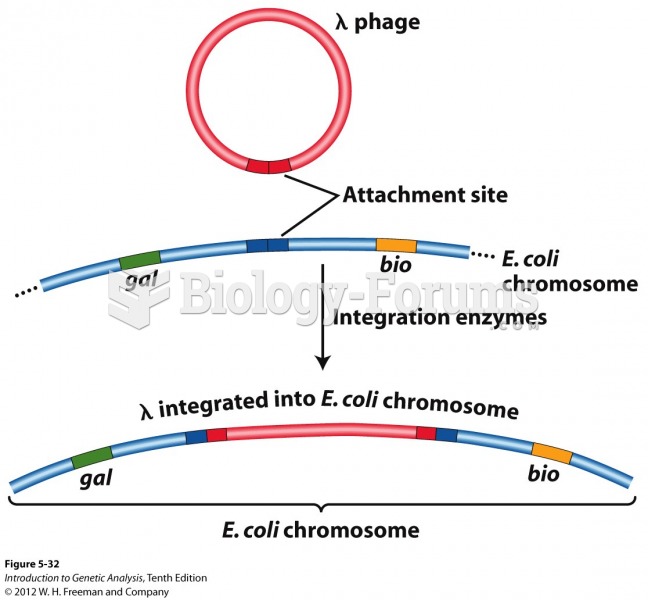 Lambda phage inserts by a crossover at a specific site
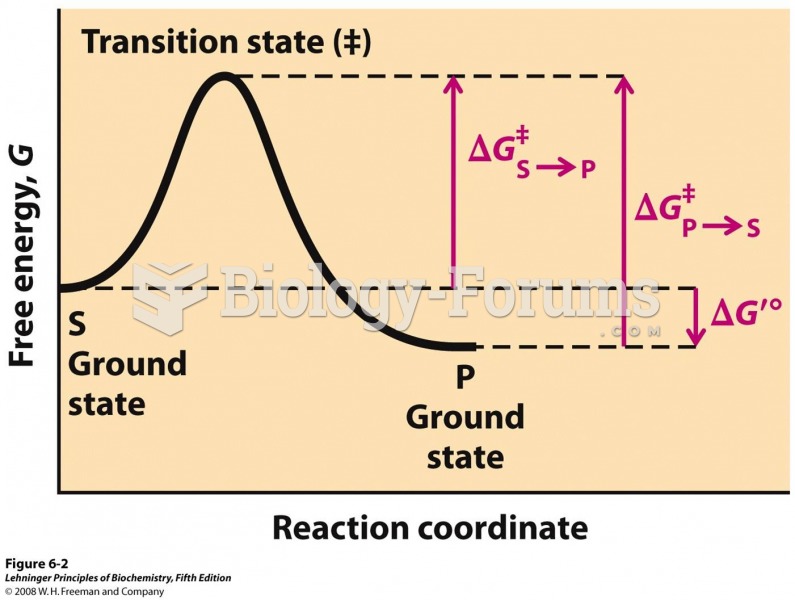 Reaction coordinate diagram
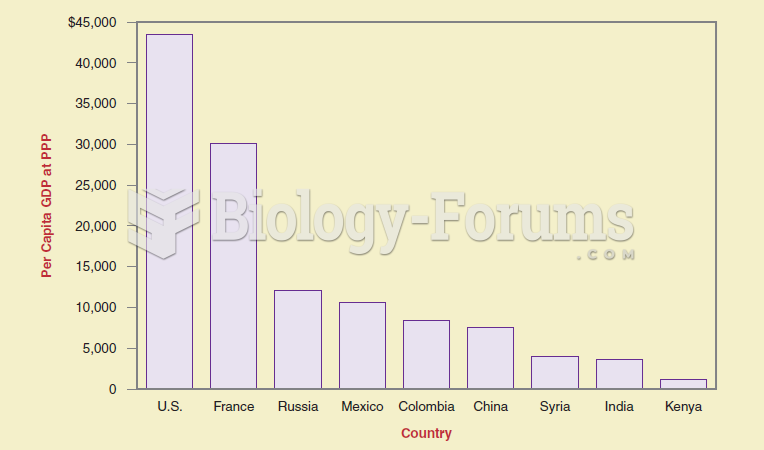 If you want to show differences between items at the same time, a bar graph is more effective than a
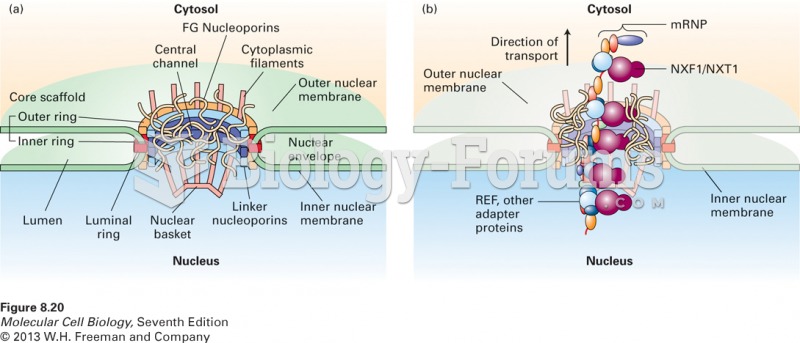 Model of transporter passage through an NPC
 Model of GAL1 and GAL10 transcriptional activation
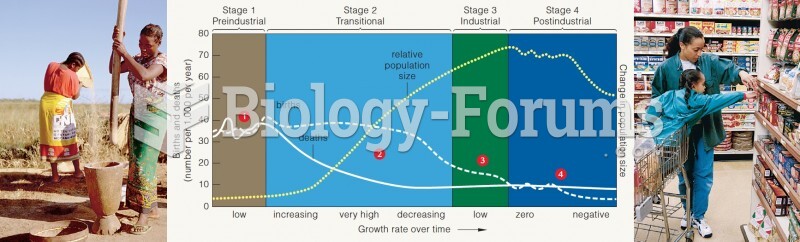 Demographic transition model for changes in population growth rates and sizes, correlated with long-