|
|
|

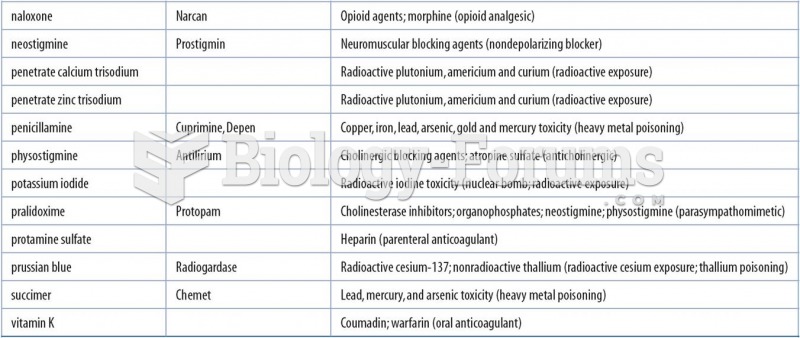 Examples of Specific Antidotes for Overdosed Substances or Toxins
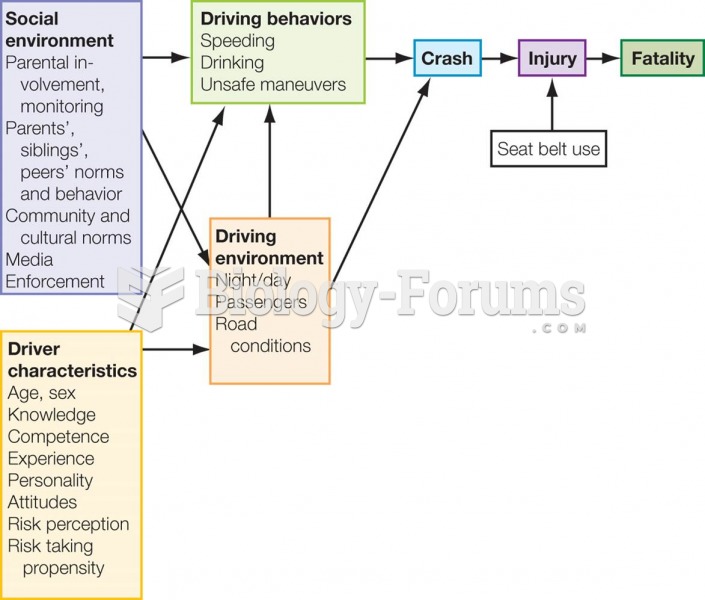 Shope’s Model of Young Driver Crash Risks The model shows that many factors contribute to crash ris
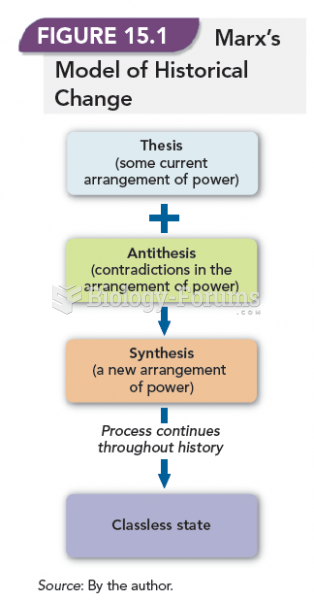 Marx's Model of Historical Change
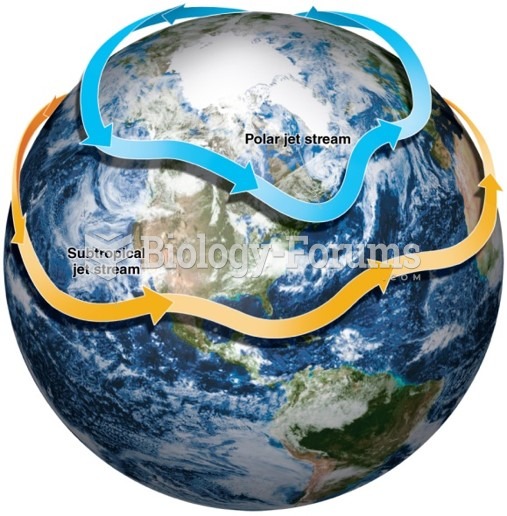 The Upper Troposphere: The Polar Front and Jet Streams
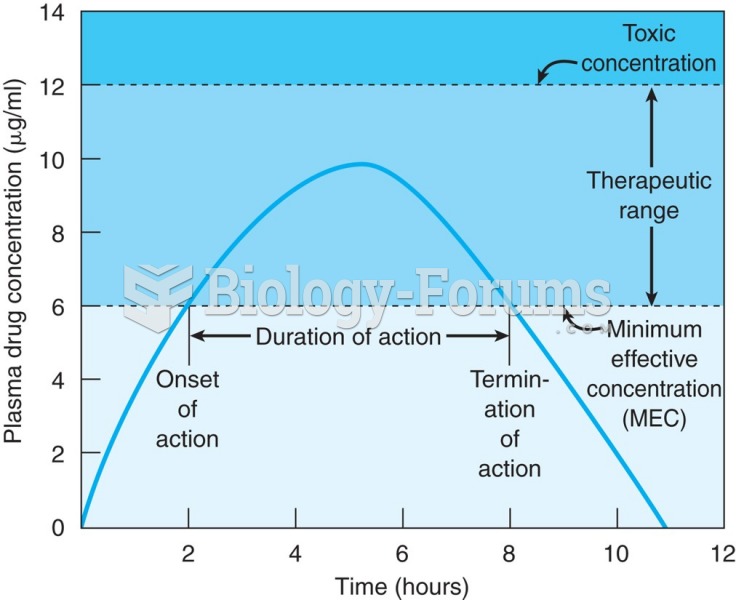 Graph showing oral administration of a single-dose drug. The time of onset is 2 hours and the end of ...