|
|
|

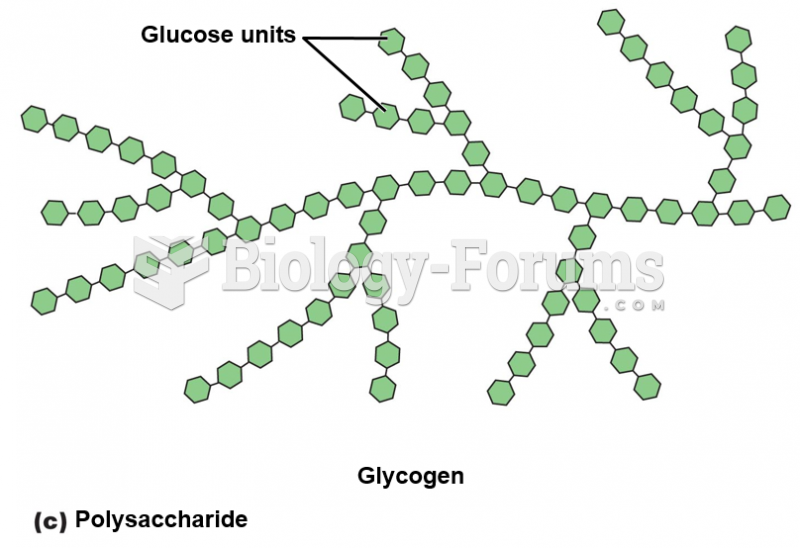 Polysaccharide Diagram
 Diathesis–stress model of depression.
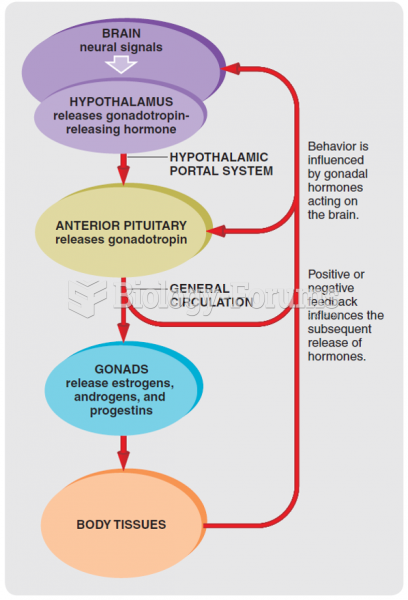 A summary model of the regulation of gonadal hormones.
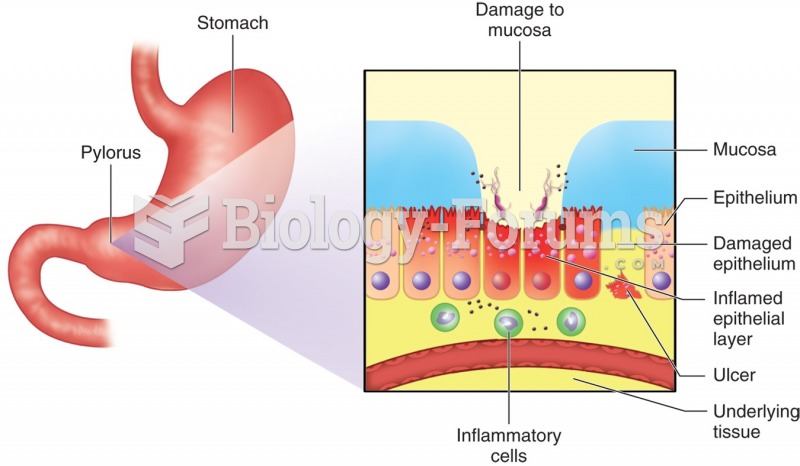 Diagram of gastric ulceration by H. pylori. H. pylori travels through the stomach's mucus ...
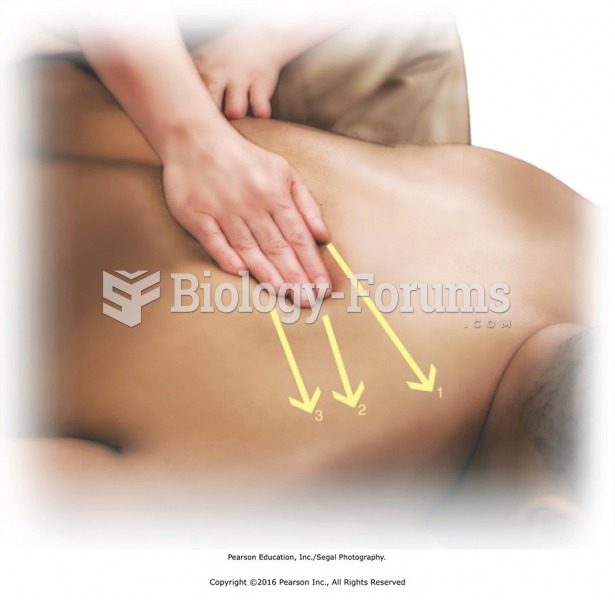 Walk around the head of the table to the left side and reach across to perform threecount stroking ...
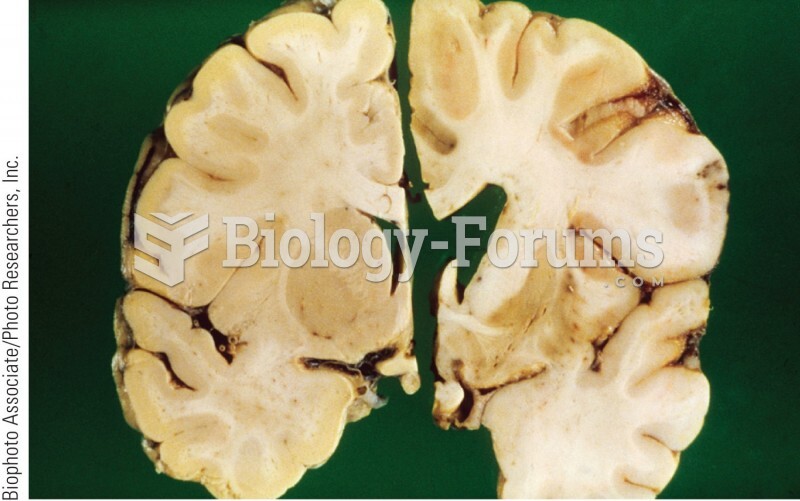 Section of a normal brain (left) and an HD brain (right). The HD brain shows extensive damage to the