|
|
|

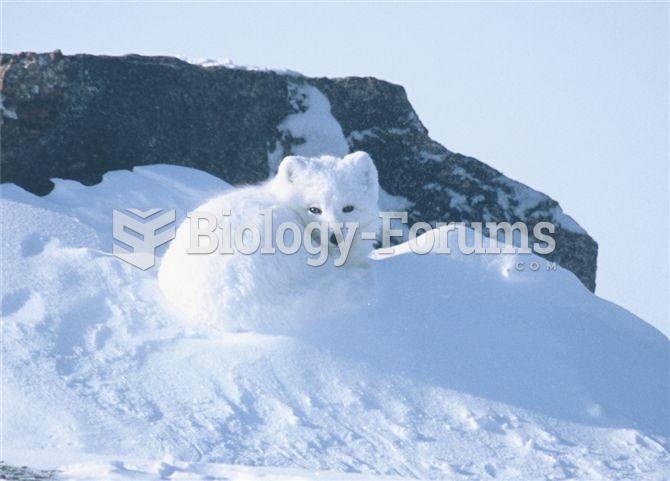 Organisms exhibit a diversity of behaviours, which include (clockwise from upper left), foraging and
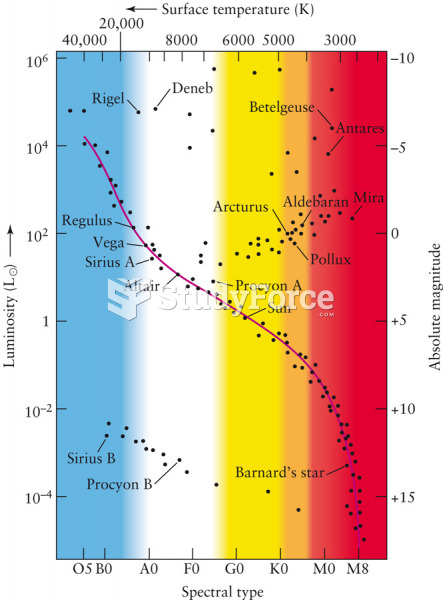 A Hertzsprung-Russell Diagram
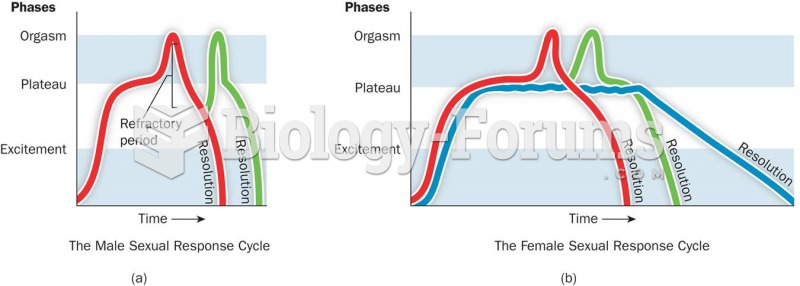 Masters and Johnson’s Four-Phase Model of the Sexual Response Cycle
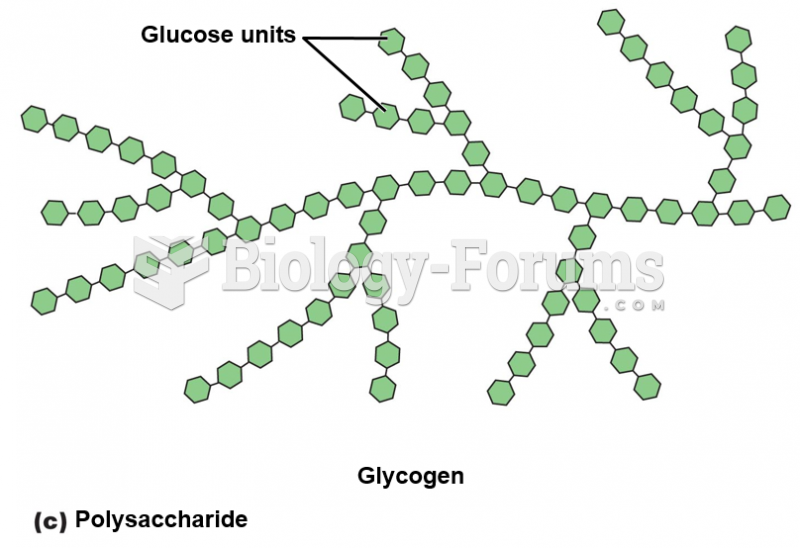 Polysaccharide Diagram
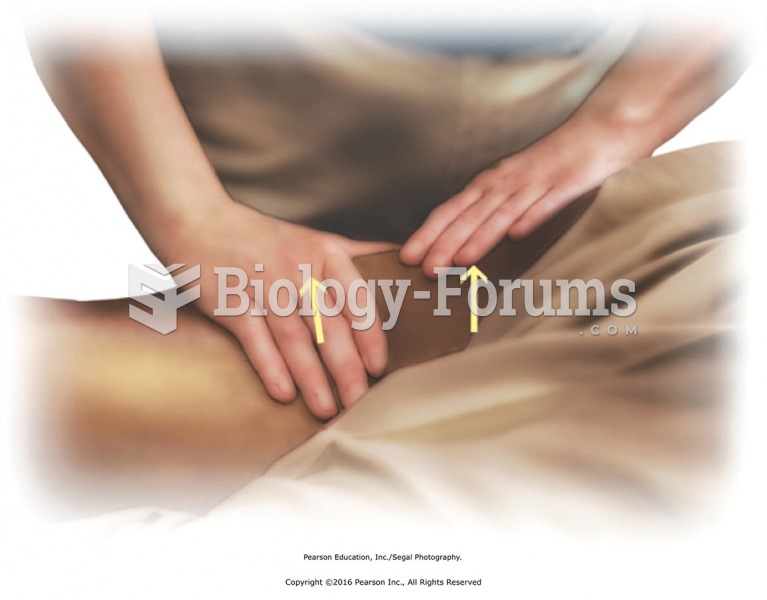 Two-handed kneading on the upper leg. Apply kneading to medial, posterior, and lateral muscles of ...
 Pioneer factors