This topic contains a solution. Click here to go to the answer
|
|
|

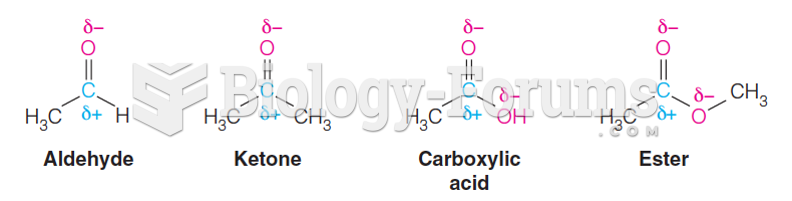 Carbonyl groups reaction type
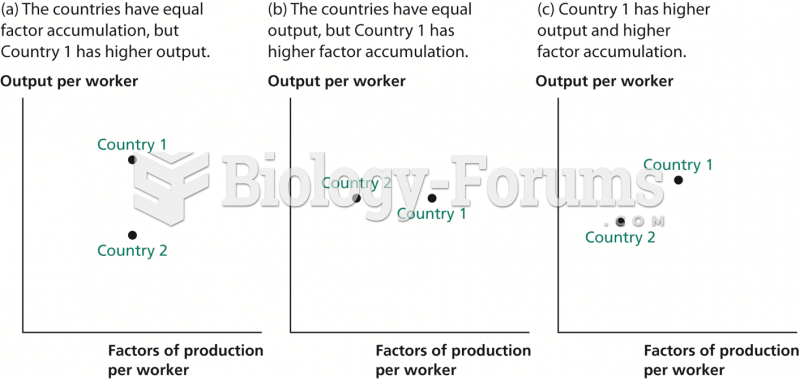 Inferring Productivity from Data on Output and Factor Accumulation
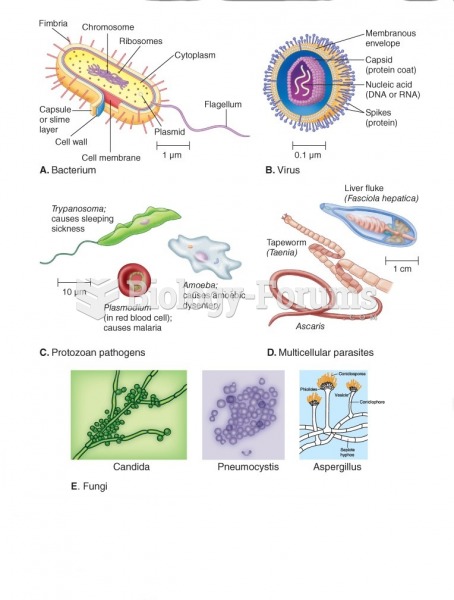 Type of pathogen organism
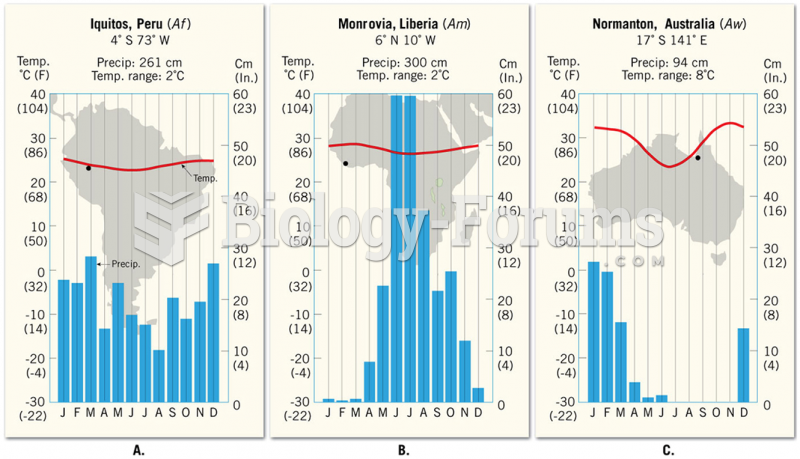 Comparison of A-type Climates
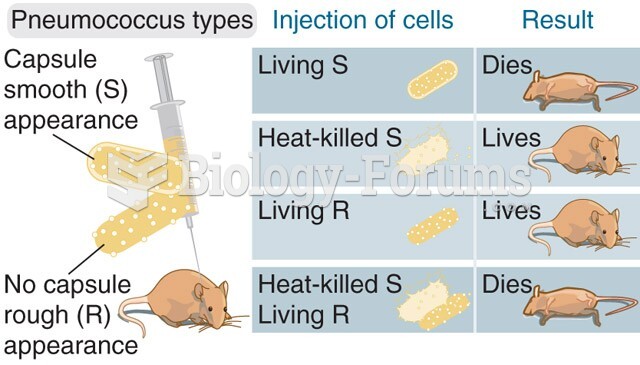 Neither heat-killed S-type nor live R-type bacteria can kill mice, but simultaneous injection of bot
 The components of the wild-type lac operon