|
|
|

 Best Statistics Question
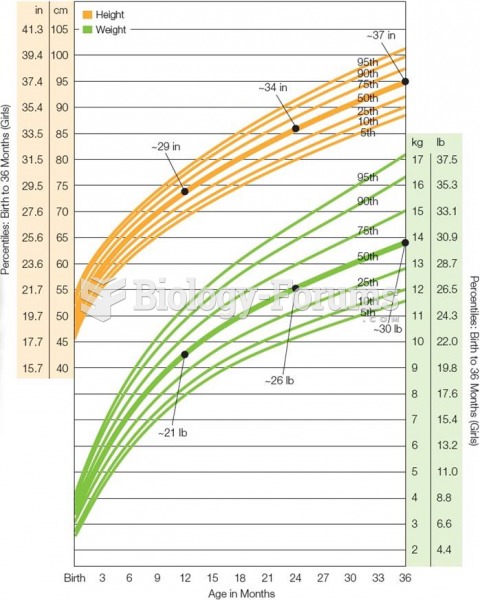 Growth Chart for American Girls From Birth Through Age 3 Growth slows from infancy to toddlerhood b
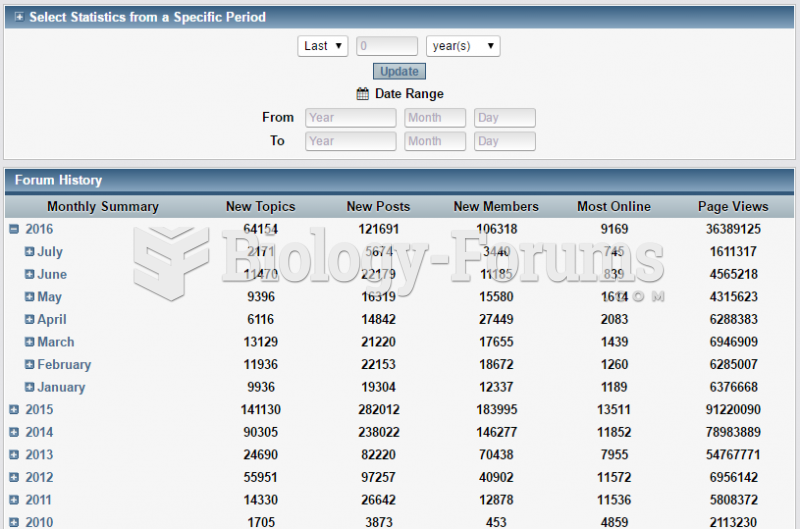 Statistics Center (07/2016)
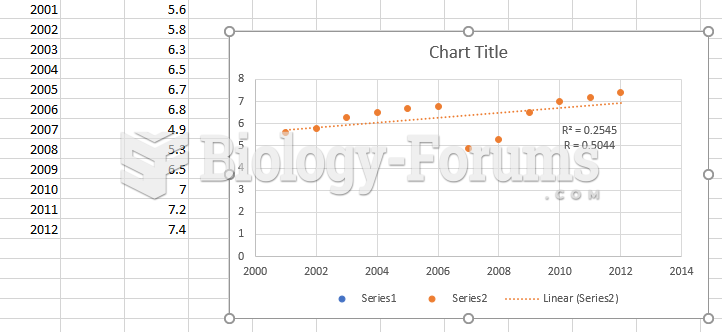
 How to analyze trends found in graphs
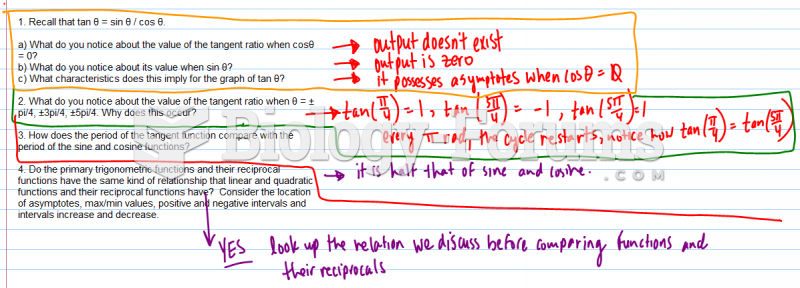 Graphs of Primary Trigonometric Ratios
 Statistics Question: A swim team