|
|
|

 Anatomical Charts Digestive System
 Descriptive Glasses
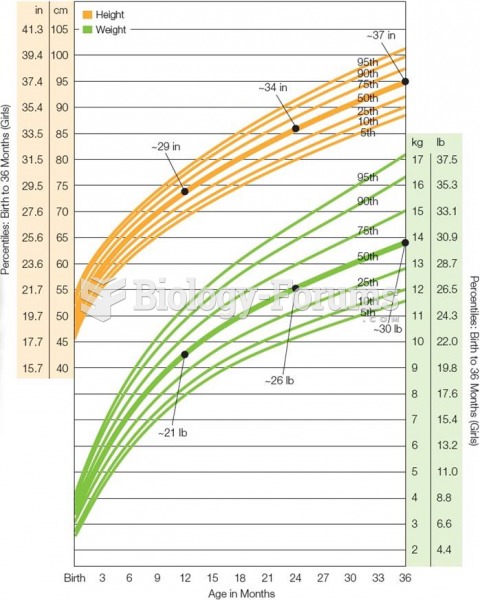 Growth Chart for American Girls From Birth Through Age 3 Growth slows from infancy to toddlerhood b
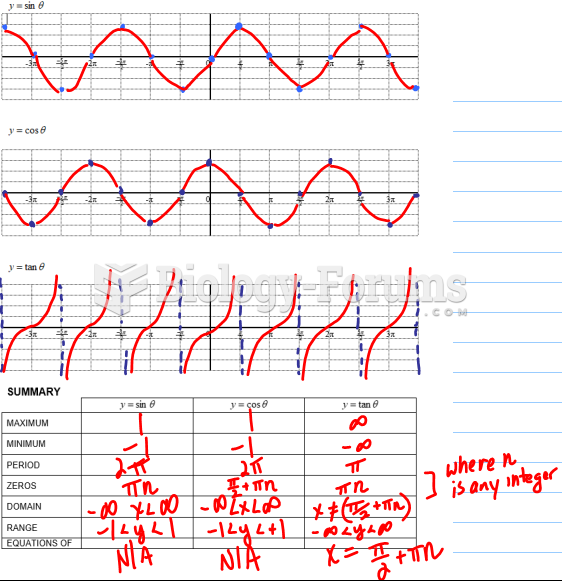 Graphs of Primary Trigonometric Ratios
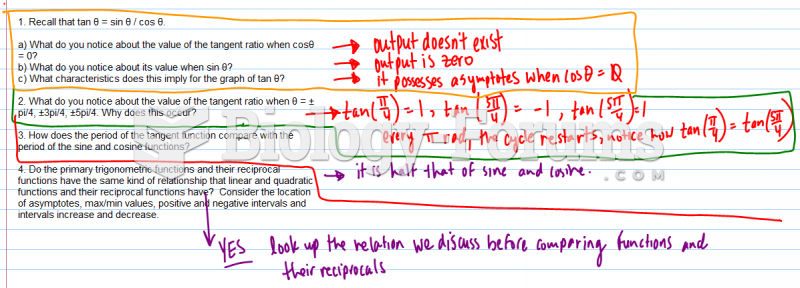 Graphs of Primary Trigonometric Ratios
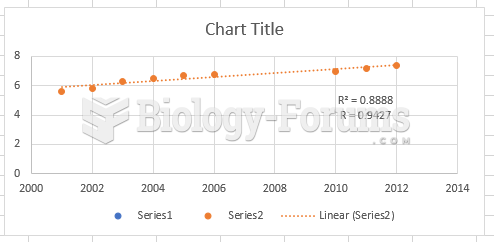 Statistics Question: A swim team