This topic contains a solution. Click here to go to the answer
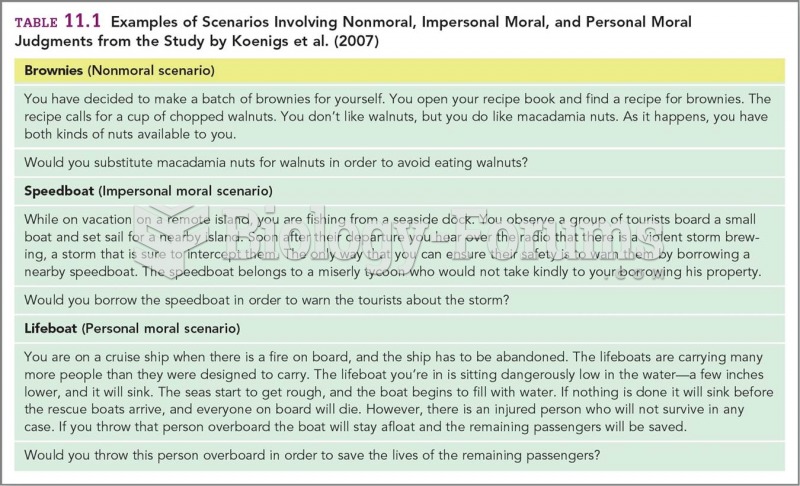
Author Question: A statistics student's presentation of the results of her study included many charts, graphs, and ... (Read 141 times)

Destiiny22

  • Hero Member
  • *****
  • Posts: 557
A statistics student's presentation of the results of her study included many charts, graphs, and tables. Identify the kind of statistical study conducted.
 
  A) The study was purely descriptive.
  B) The purpose of the study may have been completely descriptive or it might have been inferential.
  C) The study was necessarily inferential.

Question 2

The students in Hugh Logan's math class took the Scholastic Aptitude Test. Their math scores are shown below. Find n.
 
  592 429 447 349
  416 589 660 441
  635 640 482 613
  387 411 506
  A) 506.5 B) 15 C) 7597 D) 16


Related Topics

Need homework help now?

Ask unlimited questions for free

Ask a Question
Marked as best answer by a Subject Expert

soda0602

  • Sr. Member
  • ****
  • Posts: 313
Answer to Question 1

B

Answer to Question 2

B


Destiiny22

  • Member
  • Posts: 557
Reply 2 on: Jul 25, 2018
Great answer, keep it coming :)


recede

  • Member
  • Posts: 315
Reply 3 on: Yesterday
Gracias!


Did you know?

As the western states of America were settled, pioneers often had to drink rancid water from ponds and other sources. This often resulted in chronic diarrhea, causing many cases of dehydration and death that could have been avoided if clean water had been available.

Did you know?

Each year in the United States, there are approximately six million pregnancies. This means that at any one time, about 4% of women in the United States are pregnant.

Did you know?

Inotropic therapy does not have a role in the treatment of most heart failure patients. These drugs can make patients feel and function better but usually do not lengthen the predicted length of their lives.

Did you know?

On average, the stomach produces 2 L of hydrochloric acid per day.

Did you know?

Serum cholesterol testing in adults is recommended every 1 to 5 years. People with diabetes and a family history of high cholesterol should be tested even more frequently.

For a complete list of videos, visit our video library