Author Question: When a set of data is displayed using charts, graphs, and tables _____ statistics are being used. A) ... (Read 74 times)

kamilo84

  • Sr. Member
  • ****
  • Posts: 495
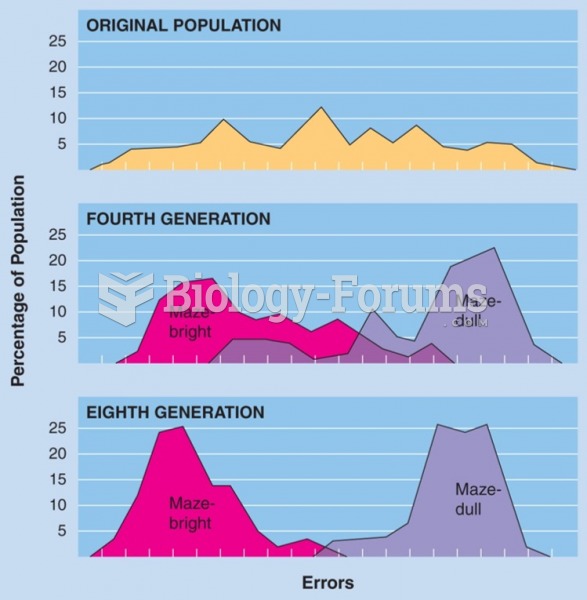
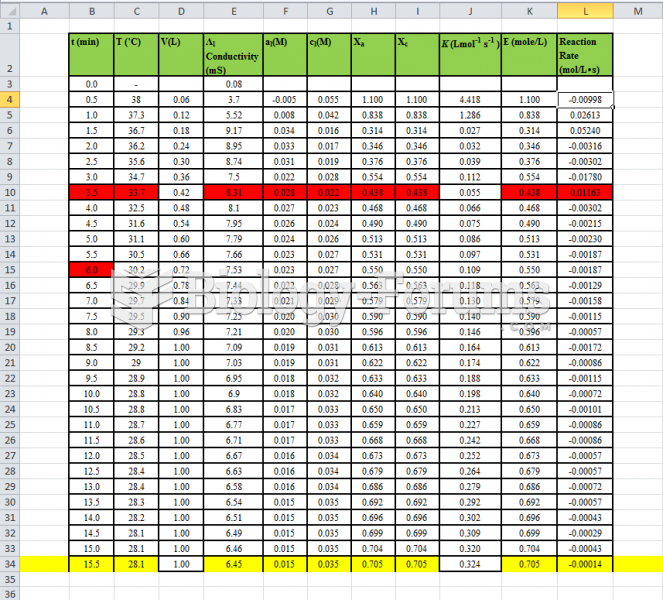
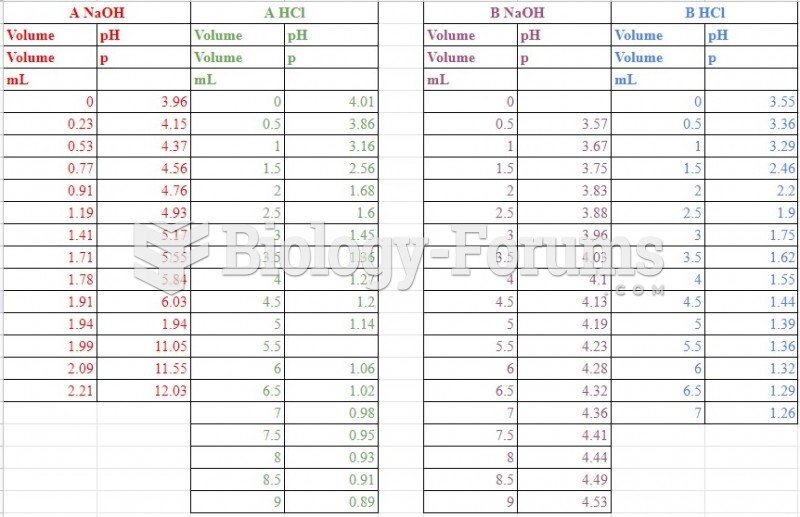
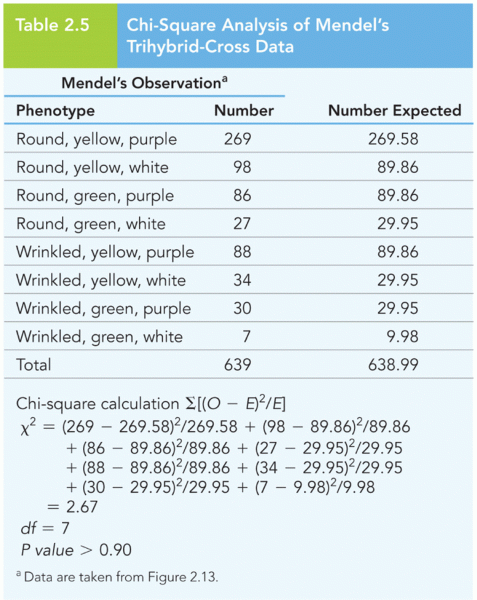
When a set of data is displayed using charts, graphs, and tables _____ statistics are being used.
 A) demographic
  B) descriptive
  C) comparative
  D) aggregate

Question 2

Data that is directly related to patients is known as:
 A) aggregate data
  B) comparative data
  C) patient-centric data
  D) transformed-based data


abro1885

  • Sr. Member
  • ****
  • Posts: 337
Answer to Question 1

B

Answer to Question 2

C


Related Topics

Need homework help now?

Ask unlimited questions for free

Ask a Question
 

Did you know?

To combat osteoporosis, changes in lifestyle and diet are recommended. At-risk patients should include 1,200 to 1,500 mg of calcium daily either via dietary means or with supplements.

Did you know?

In the United States, there is a birth every 8 seconds, according to the U.S. Census Bureau's Population Clock.

Did you know?

To prove that stomach ulcers were caused by bacteria and not by stress, a researcher consumed an entire laboratory beaker full of bacterial culture. After this, he did indeed develop stomach ulcers, and won the Nobel Prize for his discovery.

Did you know?

Despite claims by manufacturers, the supplement known as Ginkgo biloba was shown in a study of more than 3,000 participants to be ineffective in reducing development of dementia and Alzheimer’s disease in older people.

Did you know?

Stroke kills people from all ethnic backgrounds, but the people at highest risk for fatal strokes are: black men, black women, Asian men, white men, and white women.

For a complete list of videos, visit our video library