|
|
|

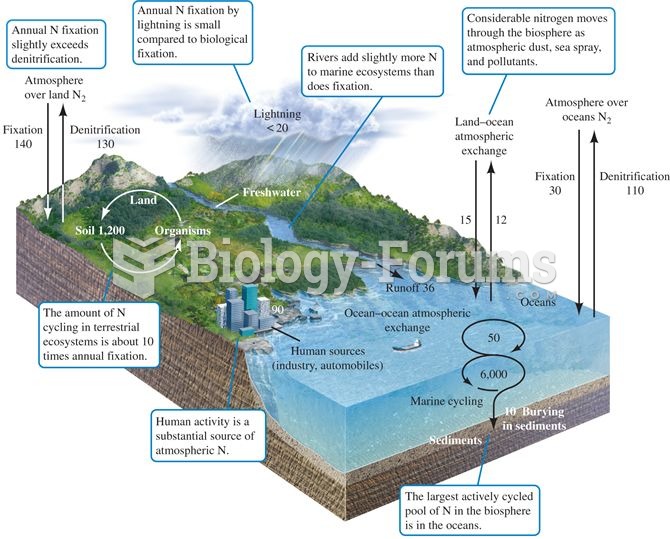 The nitrogen cycle. Numbers represent fluxes as 1012 g N per year (data from Schlesinger 1991, after
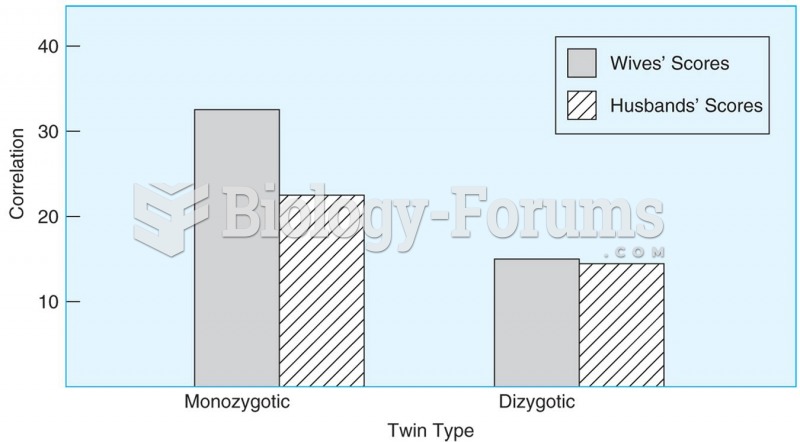 Women who are monozygotic twins and have the same genes are more similar in their marital happiness
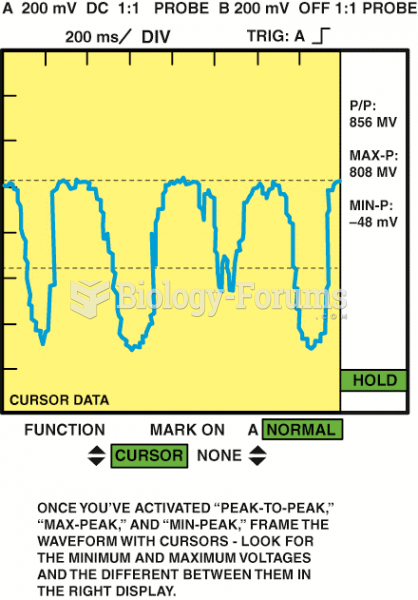 Using the cursors on the oscilloscope, the high- and low-oxygen sensor values can be displayed on ...
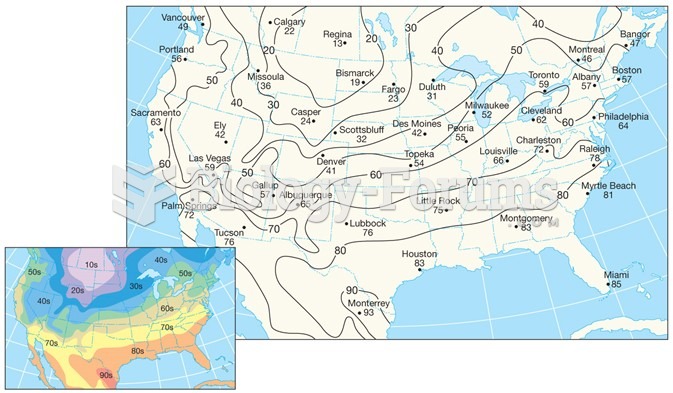 Air-Temperature Data
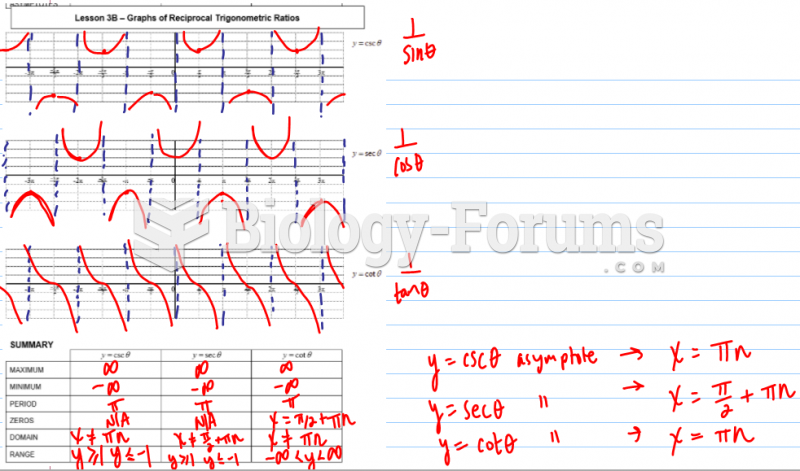 Graphs of Primary Trigonometric Ratios
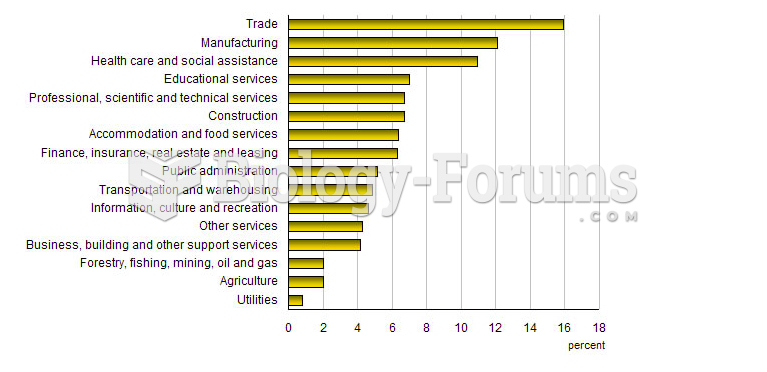 Statistics Canada, Labour Force Survey