|
|
|

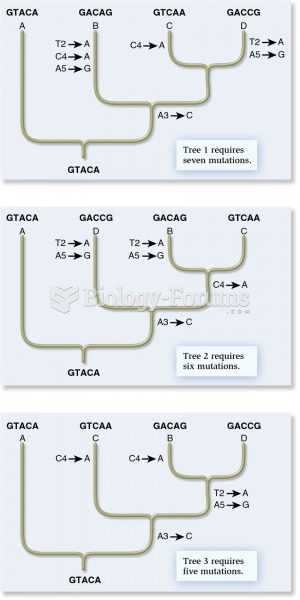 The cladistic approach from molecular genetic data
 Summary of US Census Data
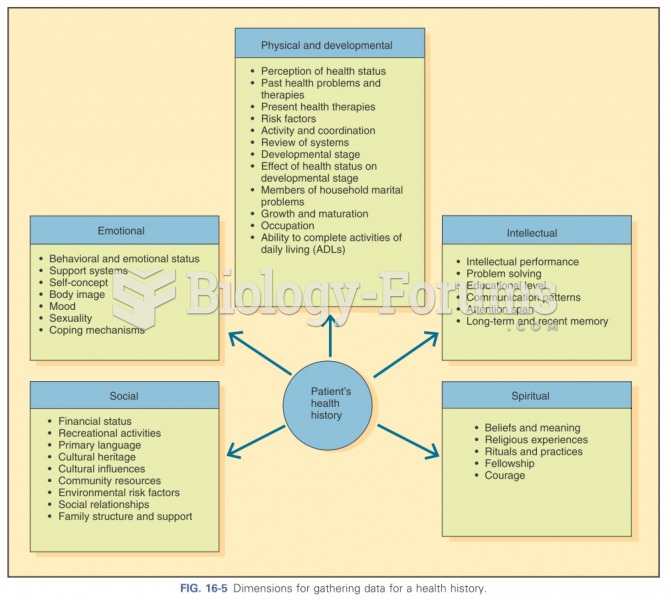 Dimensions for gathering data
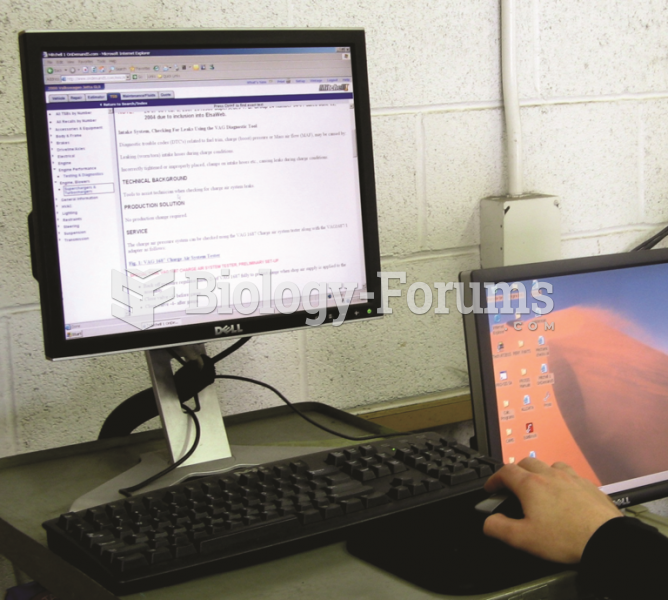 Electronic service information is available from aftermarket sources, such as All-Data and ...
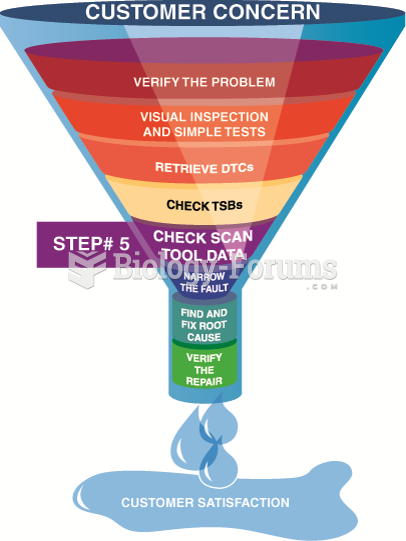 Looking carefully at the scan tool data is very helpful in locating the source of a problem.
 A hypothetical grid of data used in synteny testing