This topic contains a solution. Click here to go to the answer
|
|
|

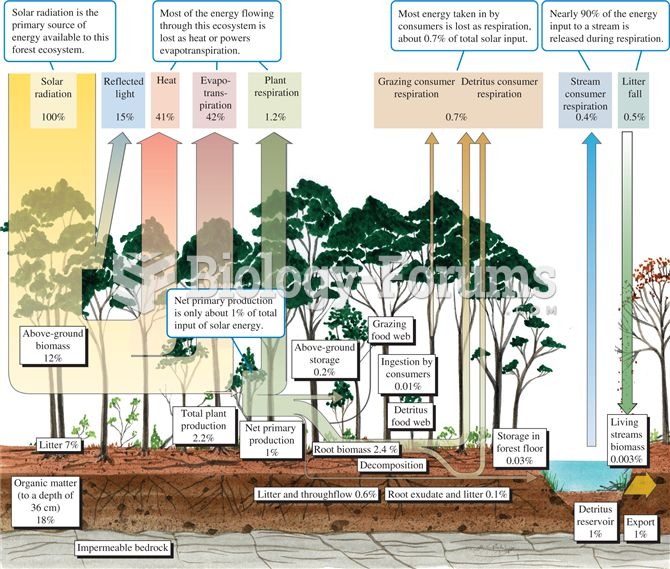 Energy budget for a temperate deciduous forest (data from Gosz et al. 1978).
 Summary of US Census Data
 Always use the viscosity of oil as specified on the oil fill cap.
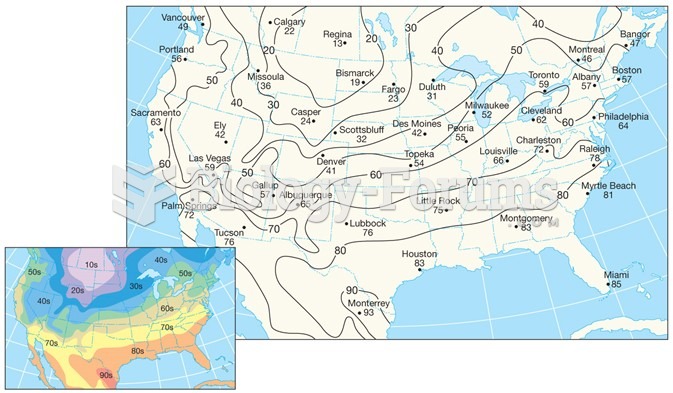 Air-Temperature Data
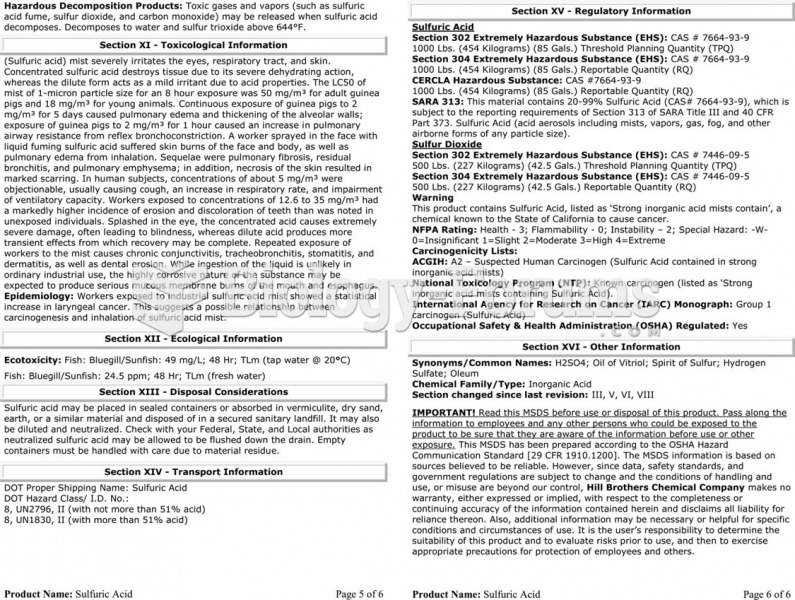 The material safety data sheet (MSDS) for sulfuric acid showing the detailed technical information ...
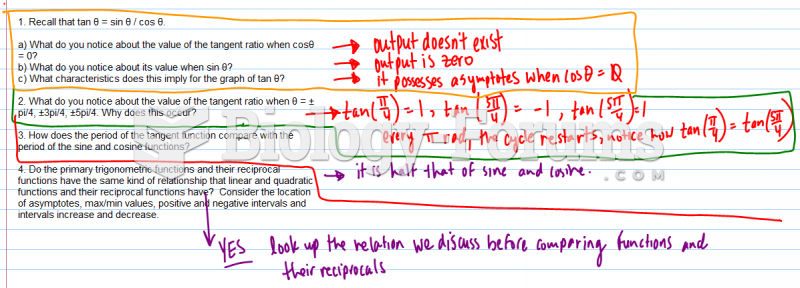 Graphs of Primary Trigonometric Ratios