This topic contains a solution. Click here to go to the answer
|
|
|

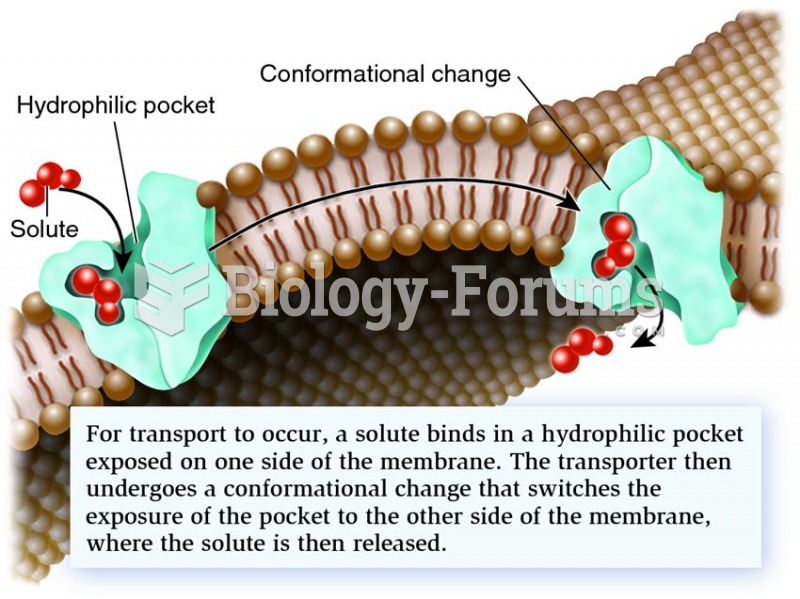 Mechanism of transport by a transporter, also called a carrier.
 Diphtheria. The bacteria that cause this disease, called Corynebacterium diphtheriae, proliferate in
 In 1839 Mary Cragin, at the age of twenty-nine, became a convert to John Humphrey Noyes’s “communism
 Prevalence of Diabetes in the United States Based on Age and Sex Data from the American Diabetes ...
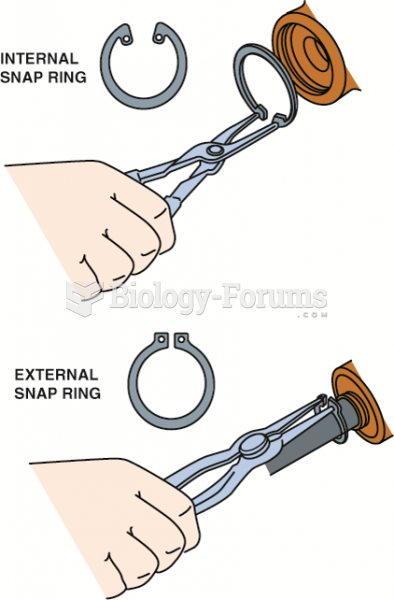 Snap-ring pliers are also called lock-ring pliers, and they are designed to remove internal and ...
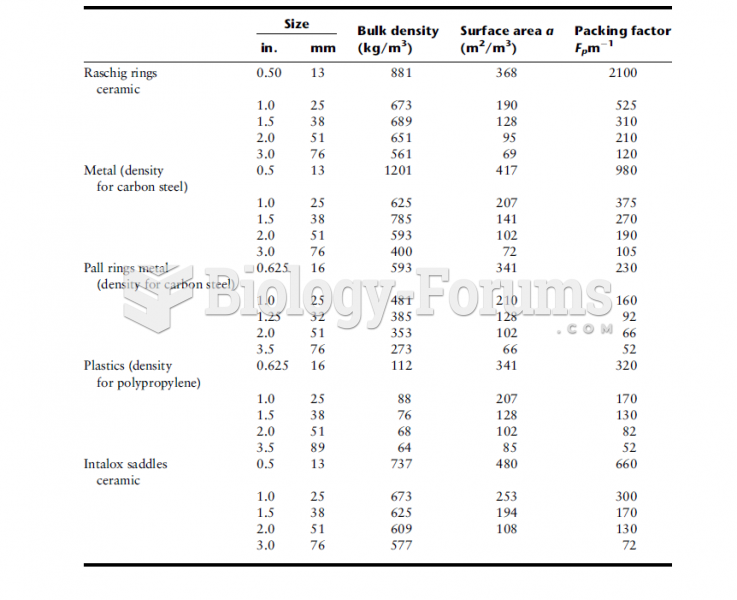 Design Data for Various Packings