|
|
|

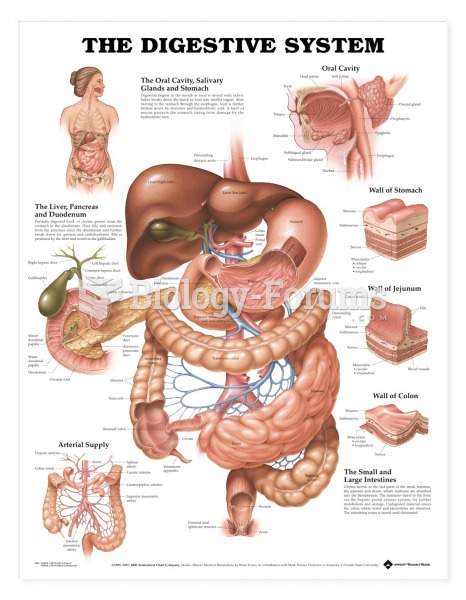 Anatomical Charts Digestive System
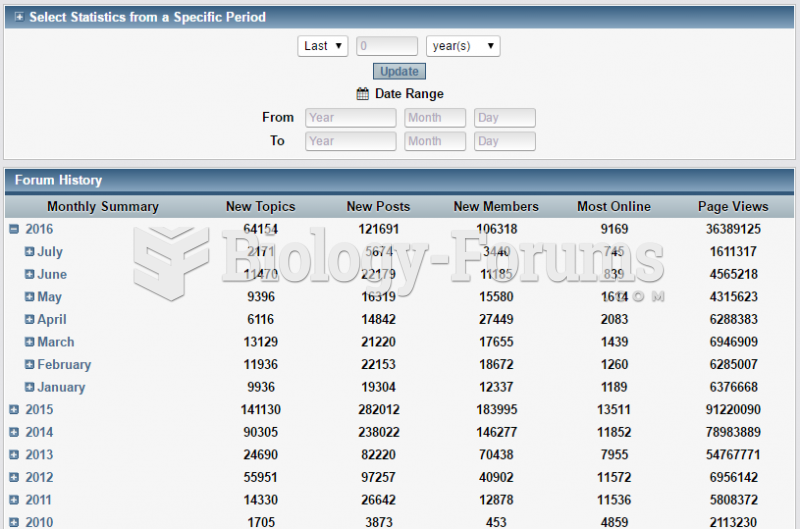 Statistics Center (07/2016)
 Statistics on how Americans commit suicide
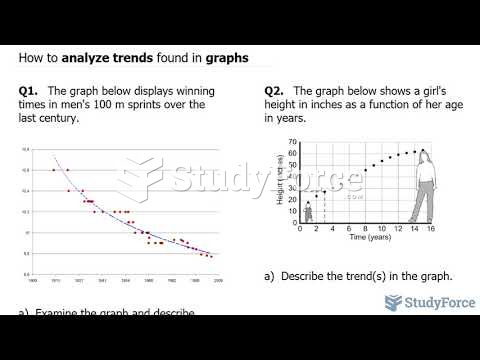 How to analyze trends found in graphs
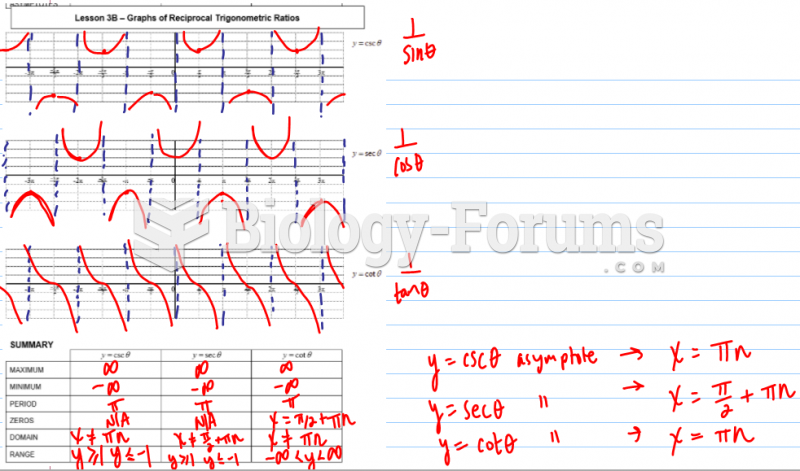 Graphs of Primary Trigonometric Ratios
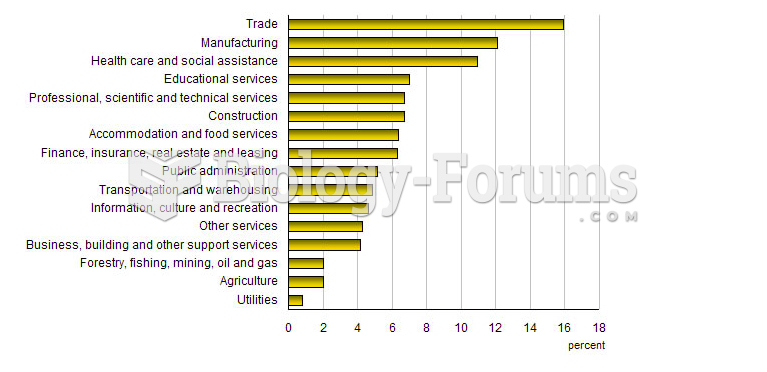 Statistics Canada, Labour Force Survey