This topic contains a solution. Click here to go to the answer
|
|
|

 Injecting an IV push (bolus) medication; C, another type of needleless syringe and needleless IV acc
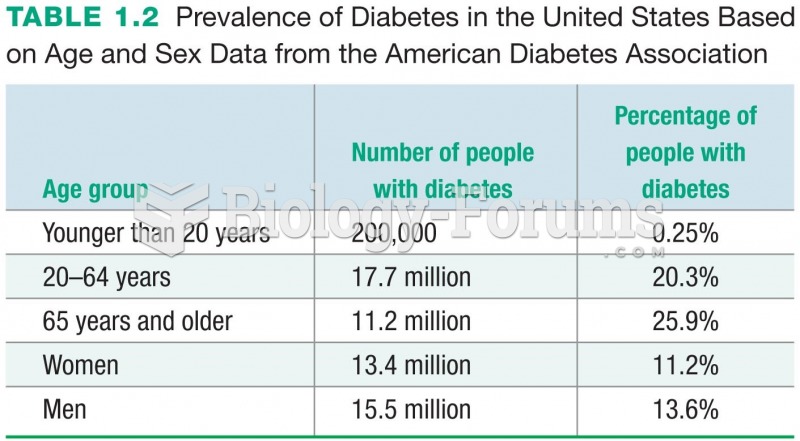 Prevalence of Diabetes in the United States Based on Age and Sex Data from the American Diabetes ...
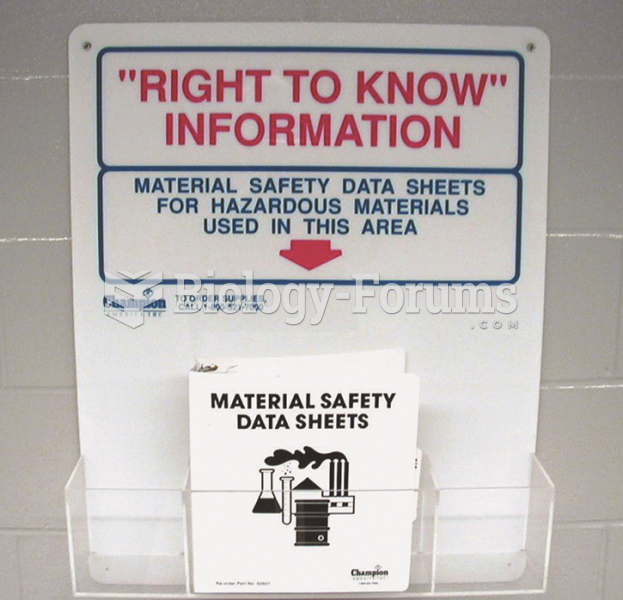 Material safety data sheets (MSDS), now called safety data sheets (SDS), should be readily available ...
 Type of rocks
 Cycads, a Type of Gymnosperm
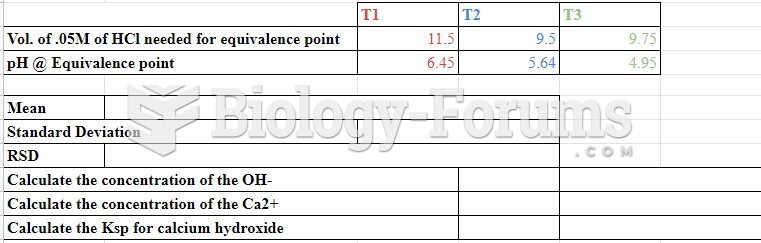 data
data