|
|
|

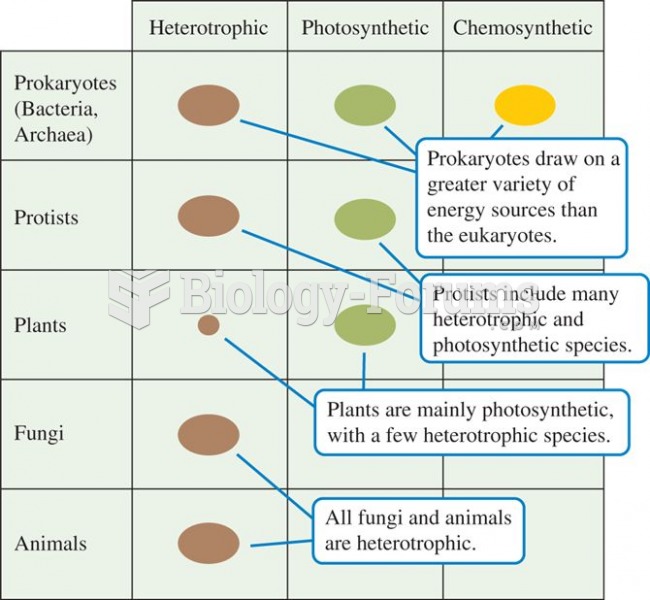 A plot of trophic diversity across the major groups of organisms shows highest trophic diversity amo
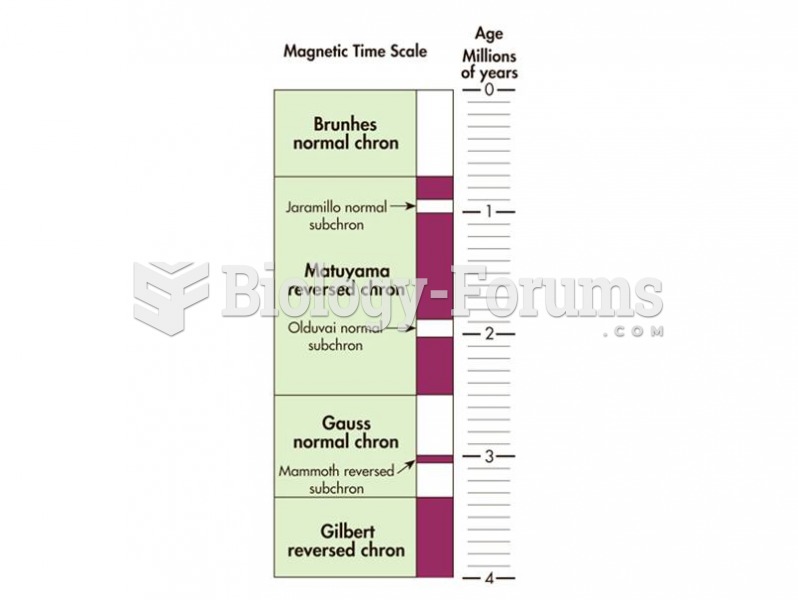 The geomagnetic polarity time scale shows how Earth’s magnetic pole has changed through geologic tim
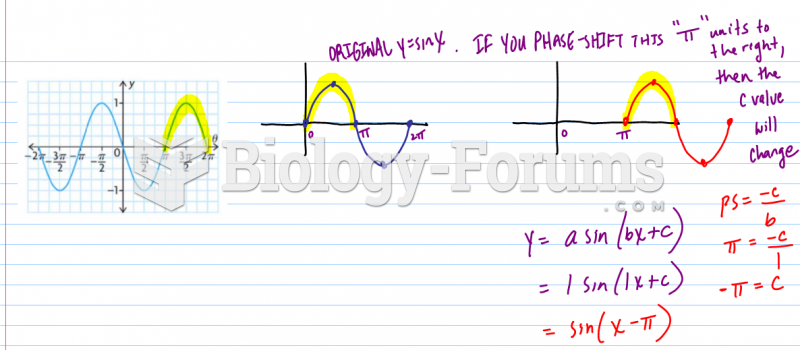
 How to reflect a sinusoidal function across the x-axis (y=a*sinb(x−c)+d)
 How to find the possible equations of a graph?
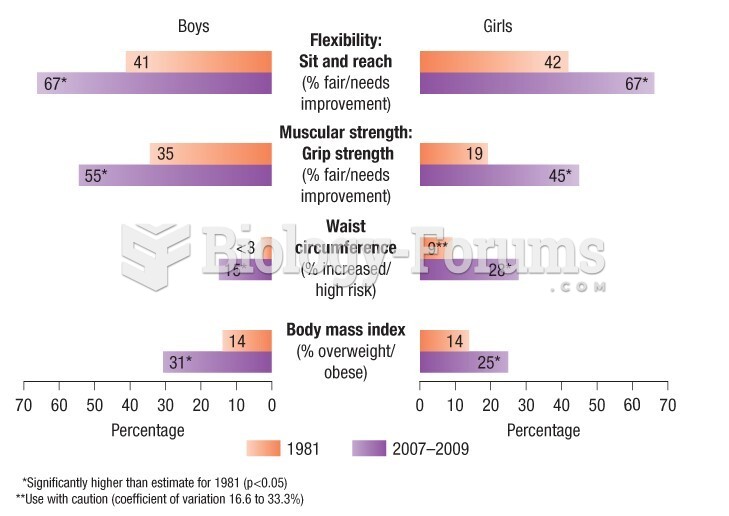 Percentage of youth age 15 to 19 years with at-risk levels of body composition & fitness
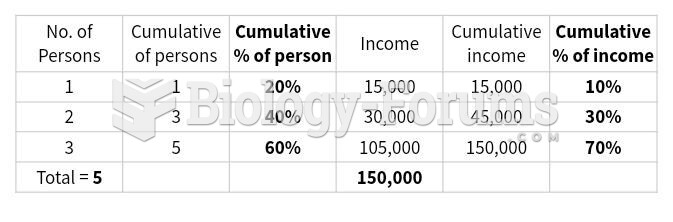 Construct a Lorenz curve that shows income distribution in this society.