|
|
|

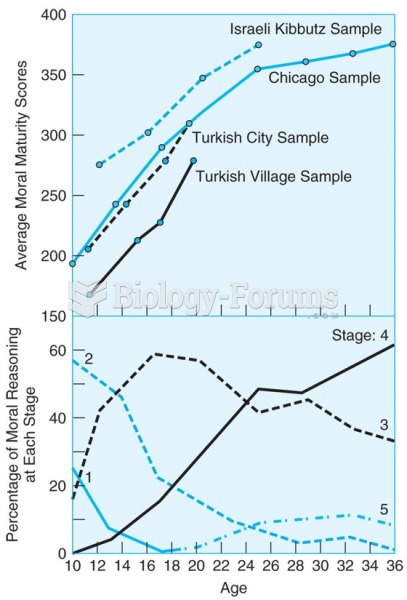 The upper panel shows that scores of four diverse samples of boys on a moral reasoning test show a ...
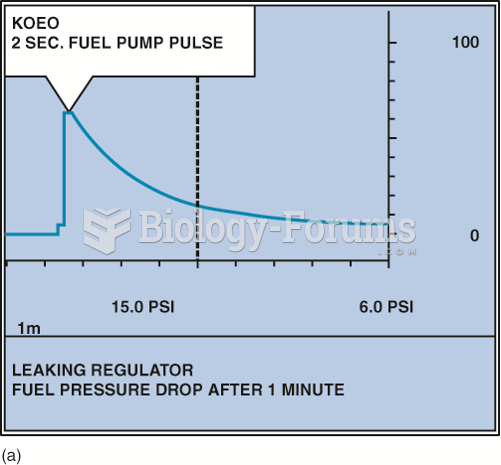 A fuel-pressure graph after key on, engine off (KOEO) on a TBI system.
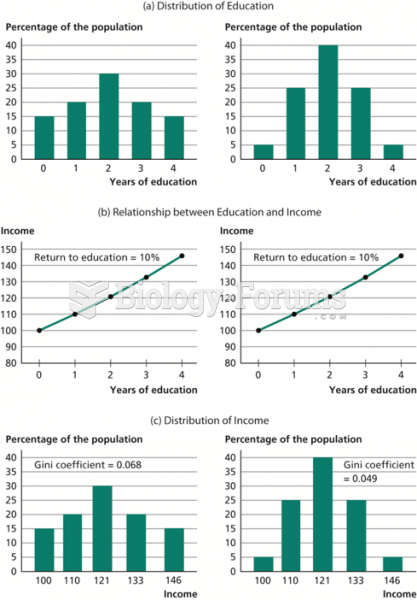 How the Distribution of Education Affects the Distribution of Income
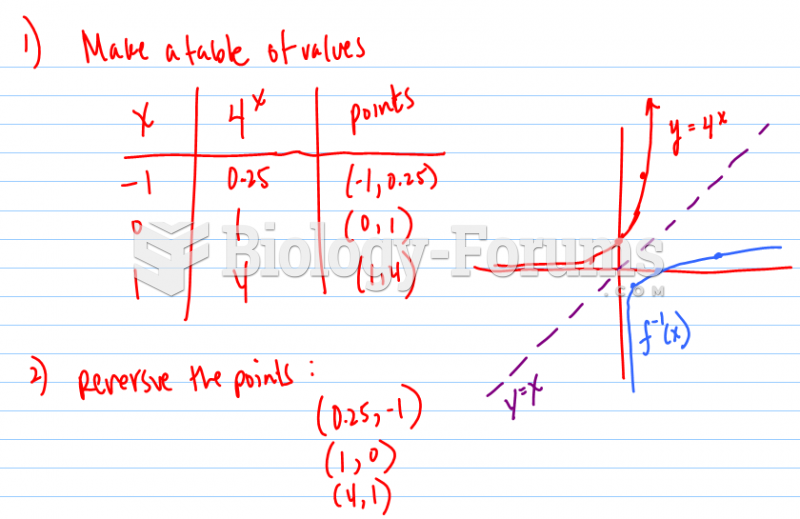 Sketch a graph of the inverse of each exponential function.
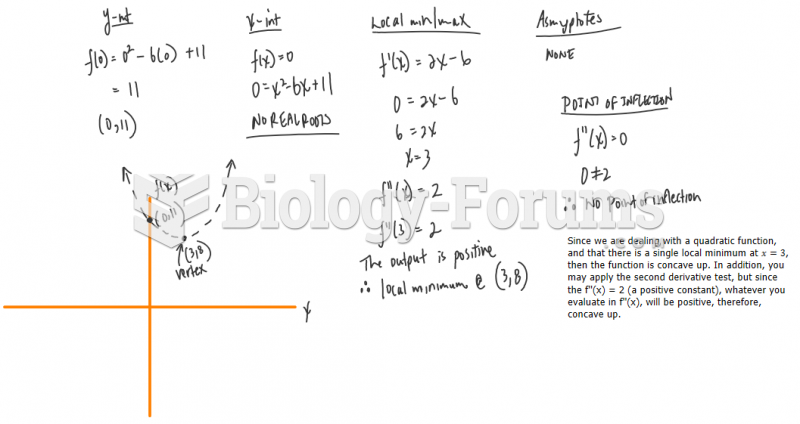 Sketch the graph of the following functions using local maximum/minimums, interc
 Linkage Data from 39 Families with Cystic Fibrosis