|
|
|

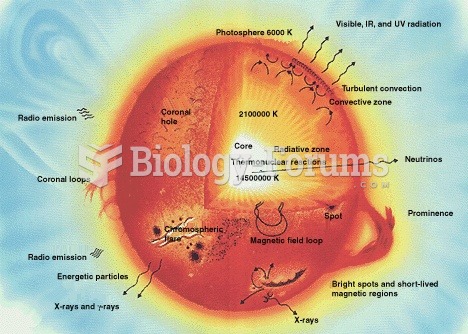 This diagram shows a cross-section of a solar-type star.
 This January 1937 photo from Sneedville, Tennessee, shows Eunice Johns, age 9, and her husband, ...
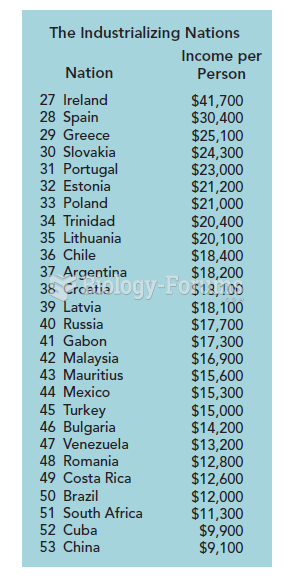 Global Stratification: Income of the World's Nations
 Positive velocity graph
 Income per Capita versus Total Fertility Rate
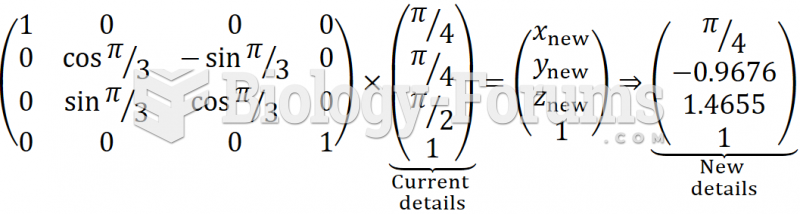 Rotating a matrix along the x-axis multiplication