|
|
|

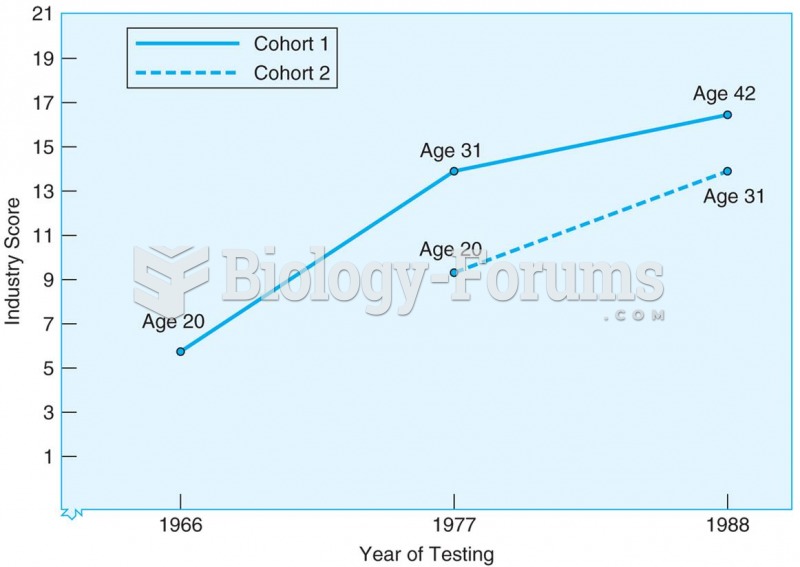 Results from sequential study of two cohorts tested at three ages and at three different points in t
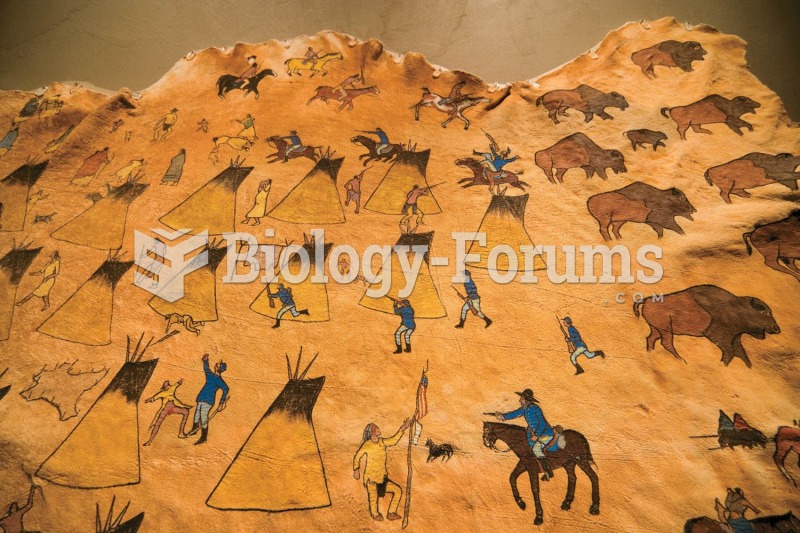 This Native American depiction of the Sand Creek Massacre, painted on a buffalo hide, shows the Indi
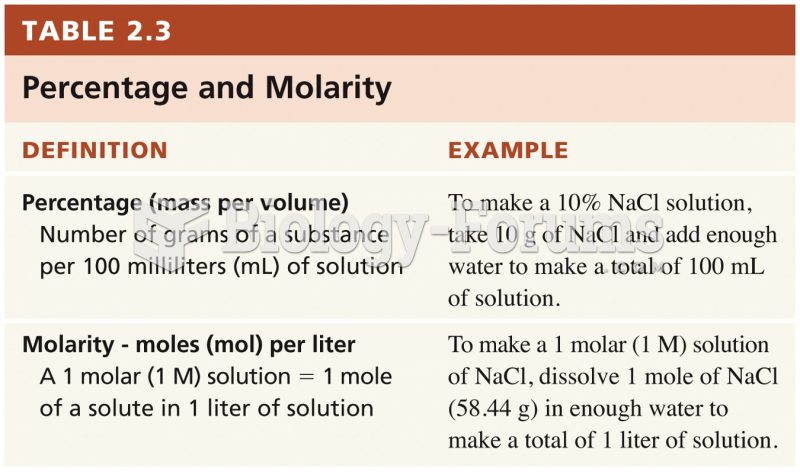 Percentage & Molarity
 Graph shows the living arrangements of Canadian seniors
 Variable and absorption costing, explaining operating-income differences.
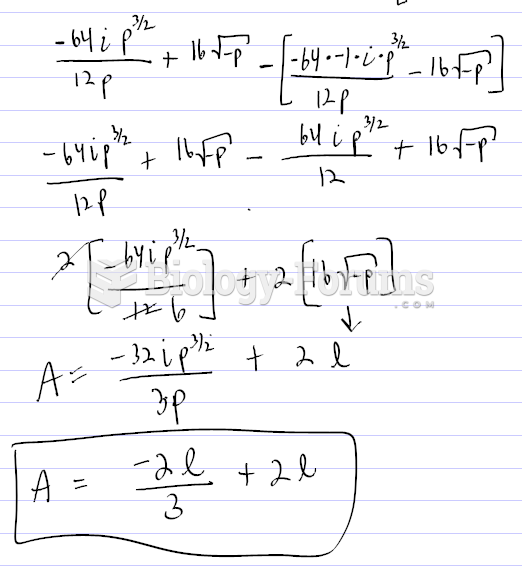 Finding the graph of a Parabola using certain values