|
|
|

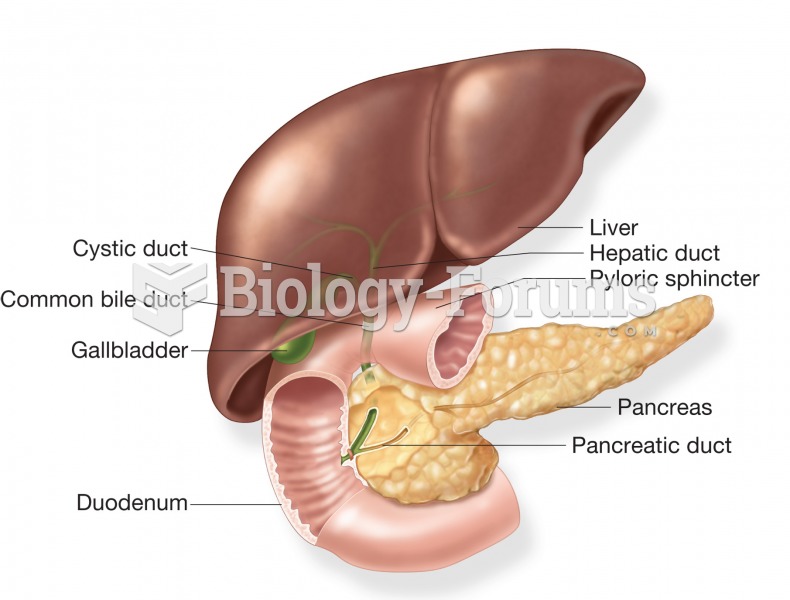 The accessory organs of the digestive system: the liver, gallbladder, and pancreas. Image shows the
 A nurse shows empathy to a client.
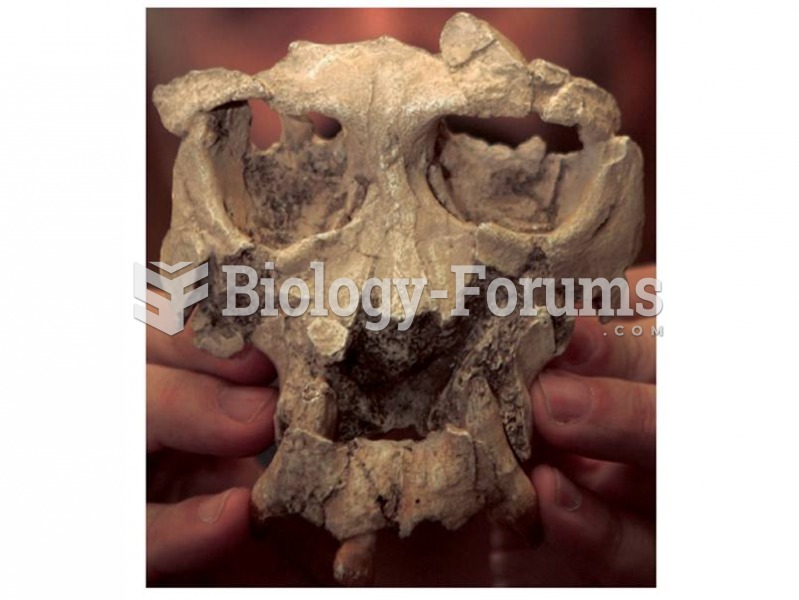 Pierolapithecus catalunicus may be an ancestor of great apes and humans. Its postcranial skeleton sh
 Demonstrate the Application of Triangular, Figure-Eight, and Tubular Bandages
 The population of Asia increases rapidly, the demand for food and water is also growing
 Who Oversees the Food Supply?