|
|
|

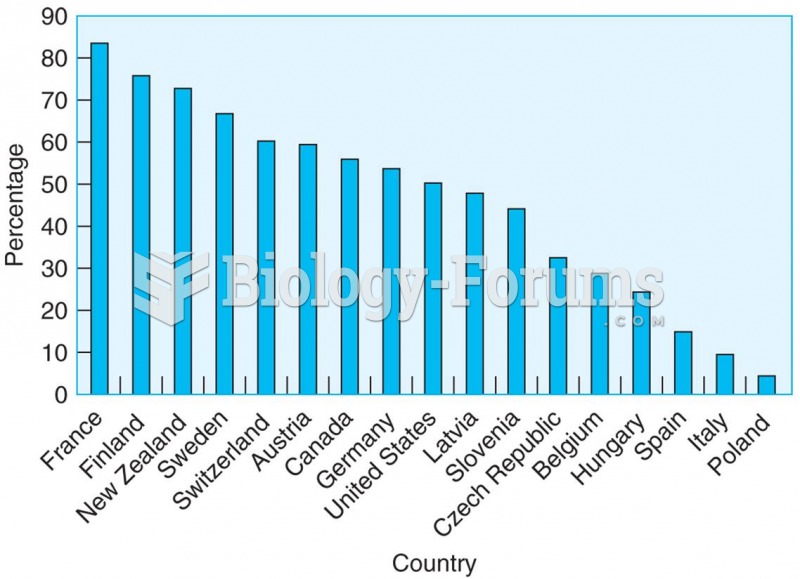 The percentage of women who have cohabited by the age of 45 for 17 countries shows that the ...
 Mobilize hand and wrist joints. Apply scissoring to knuckles and figure-8s to fingers. Holding the ...
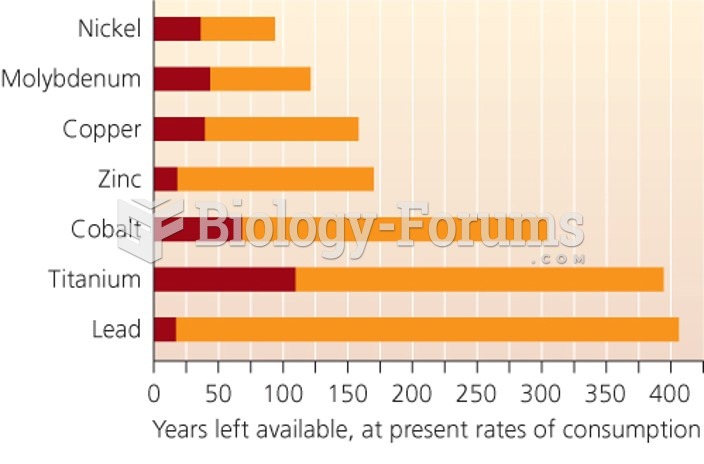 Minerals are nonrenewable resources in limited supply
 Monitoring shows that many forms of air pollution have decreased
 Economic recession in 2008 saw a small decrease in demand
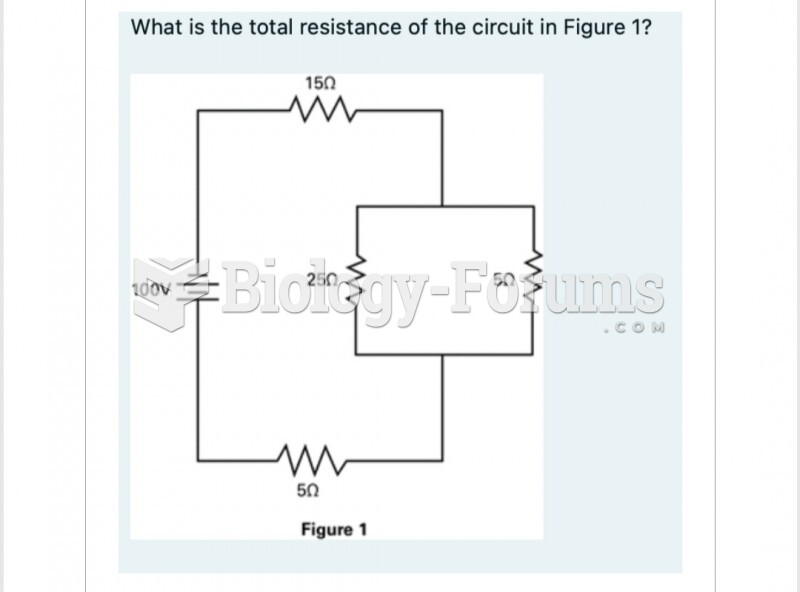 What is the total resistance of the circuit in Figure 1? 150