|
|
|

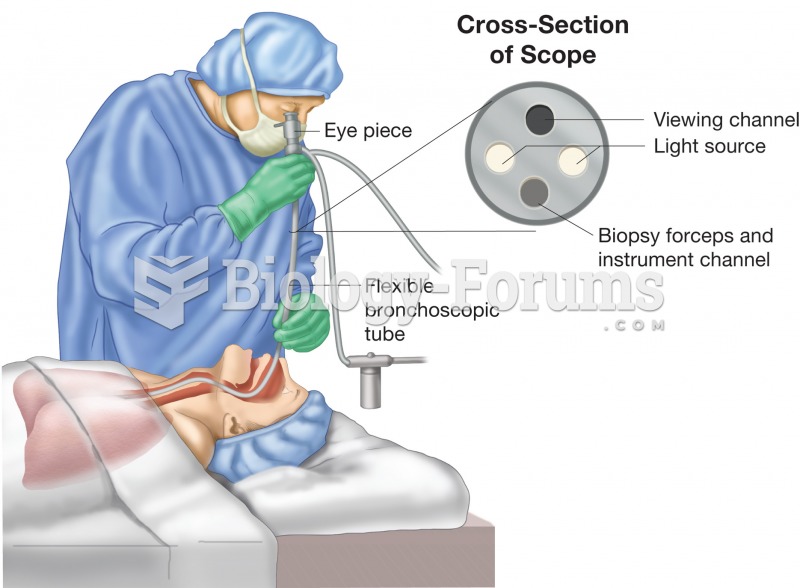 Bronchoscopy. Figure illustrates physician using a bronchoscope to inspect the patient’s bronchial t
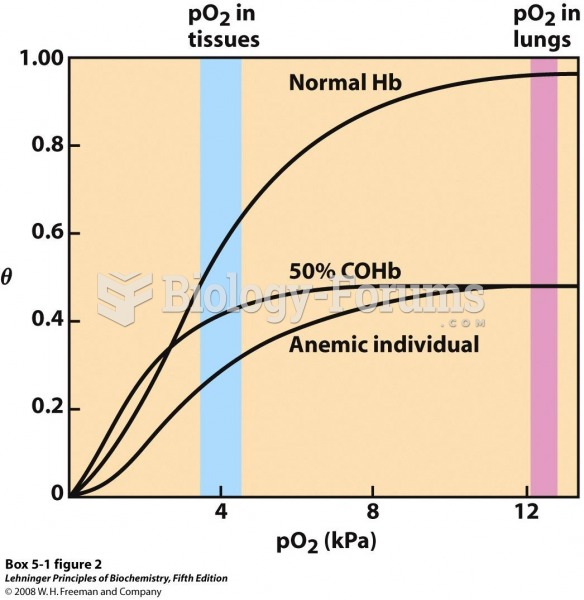 2 Several oxygen-binding curves: for normal hemoglobin
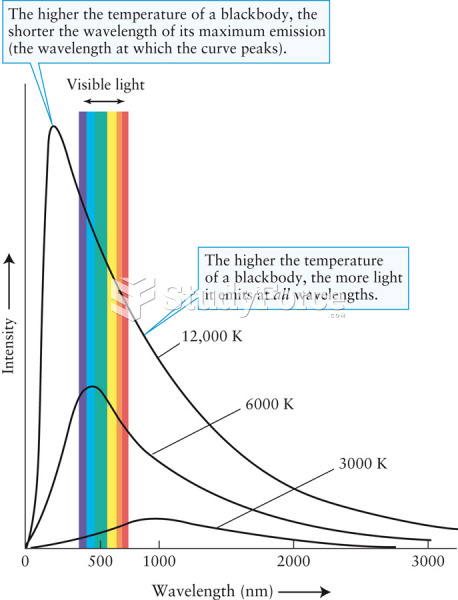 Blackbody Curves
 Mobilize joints of the feet and ankle. Apply scissoring to metatarsals and figure-8s to toes. Dorsi- ...
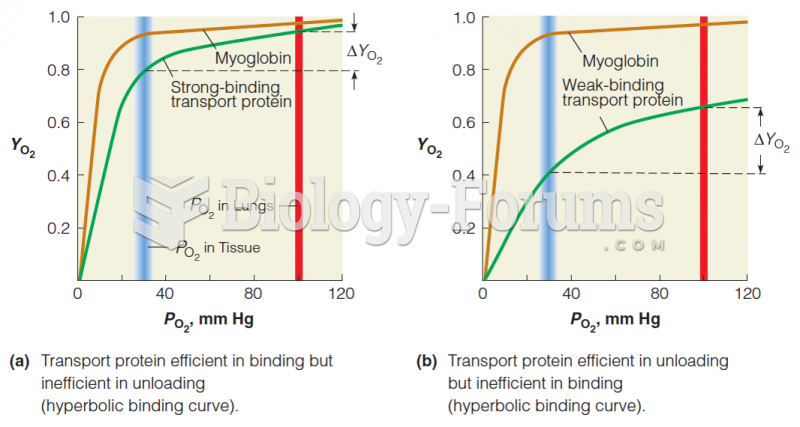 Cooperative vs. noncooperative O2-binding curves
 The growth in demand for oil in China is driven by the growth in demand for personal transport