|
|
|

Did you know?
Methicillin-resistant Staphylococcus aureus or MRSA was discovered in 1961 in the United Kingdom. It if often referred to as a superbug. MRSA infections cause more deaths in the United States every year than AIDS.

 This photo shows a newborn baby minutes after birth.
 The posted octane rating in most high-altitude areas shows regular at 85 instead of the usual 87.
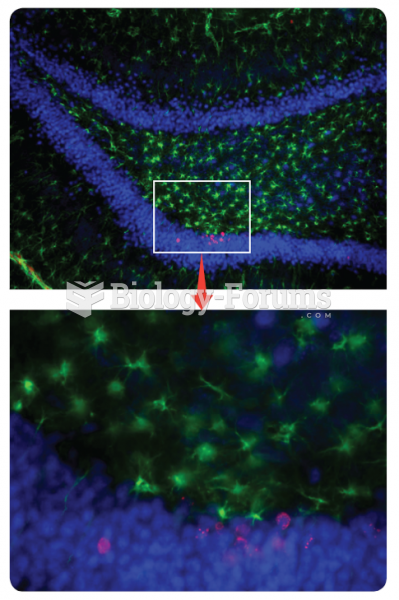 Adult neurogenesis. The top panel shows new cells in the dentate gyrus of the hippocampus—the cell ...
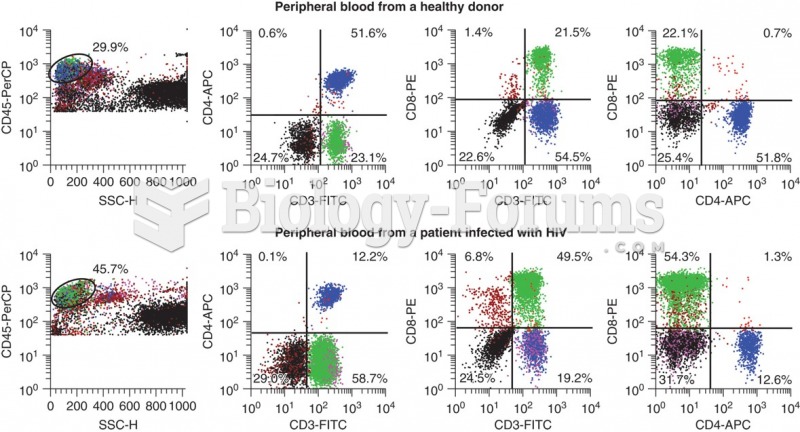 Flow cytometry data that shows the differences in CD3+ CD4+ cells that occur with HIV infection. ...
 Swimming Pool (Figure 3.1)
 Figure 2.15.jpg