|
|
|

 Views of the Milky Way’s Central Regions
 The “Old Man” from La Chapelle shows evidence of extensive tooth loss and bone resorption.
 Far Oceania was the last of the regions of the world to be colonized by humans.
 This January 1937 photo from Sneedville, Tennessee, shows Eunice Johns, age 9, and her husband, ...
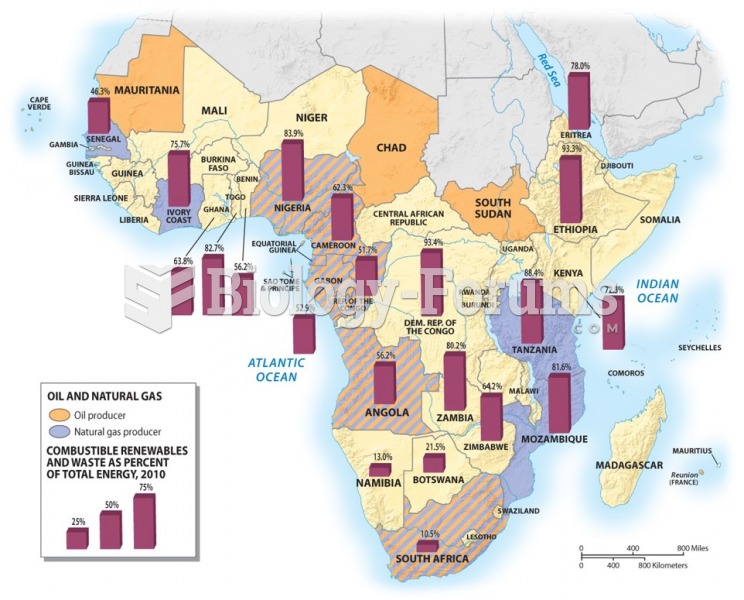 Energy Production
 The Production of Cytotoxic T-lymphocytes (CTLs)