|
|
|

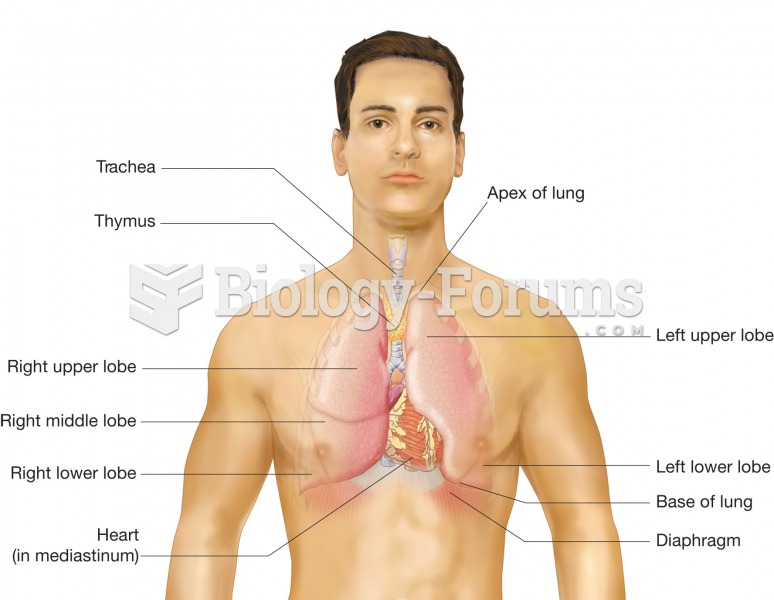 Position of the lungs within the thoracic cavity; anterior view illustrating regions of the lungs an
 Views of the Milky Way’s Central Regions
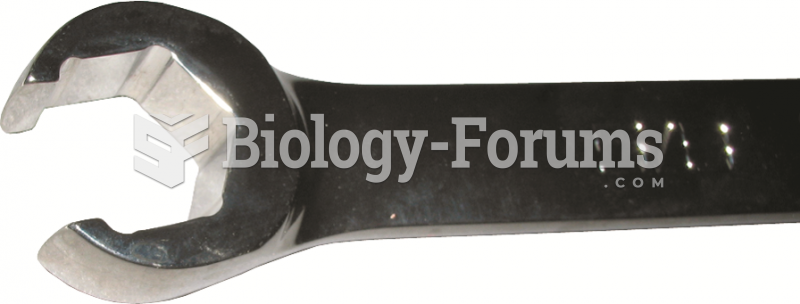 The end of a typical line wrench, which shows that it is capable of grasping most of the head of ...
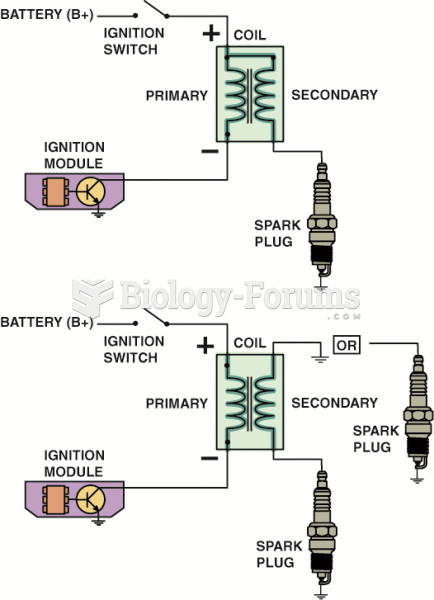 Some ignition coils are electrically connected, called married (top figure), whereas others use ...
 Statuette of a Male Figure
 Mechanisms involved in production of metabolic alkalosis due to loss of gastric fluid