|
|
|

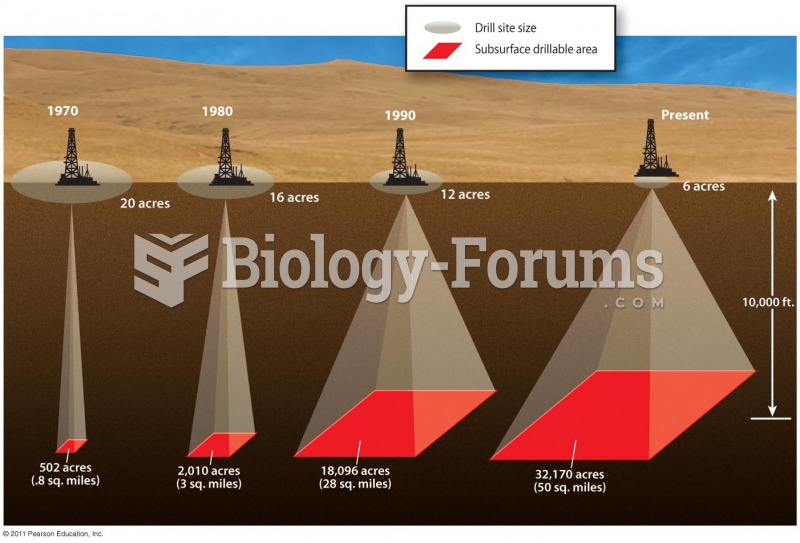 Oil and Natural Gas Production from More Wells in Smaller Areas
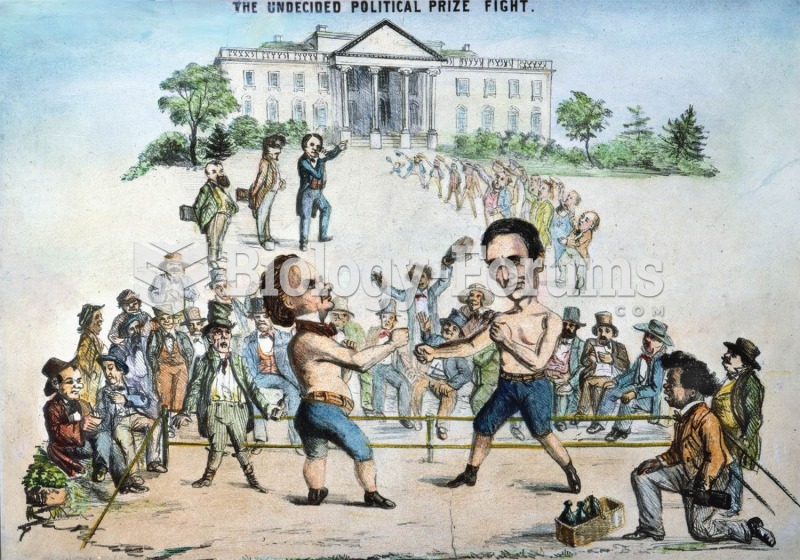 That politics was always a rough business is shown in this cartoon, which shows Lincoln, assisted by
 C. Wright Mills (1916-1962) was a controversial figure in sociology because of his analysis of the ...
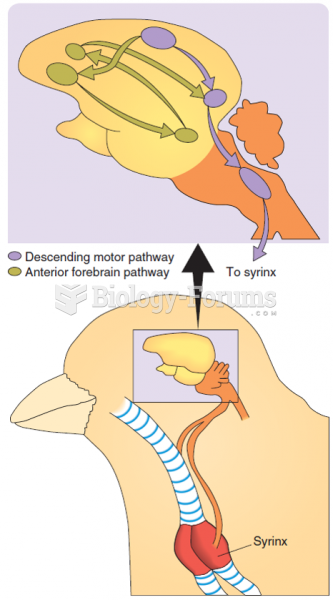 The neural pathway responsible for the production and learning of song in the male canary.
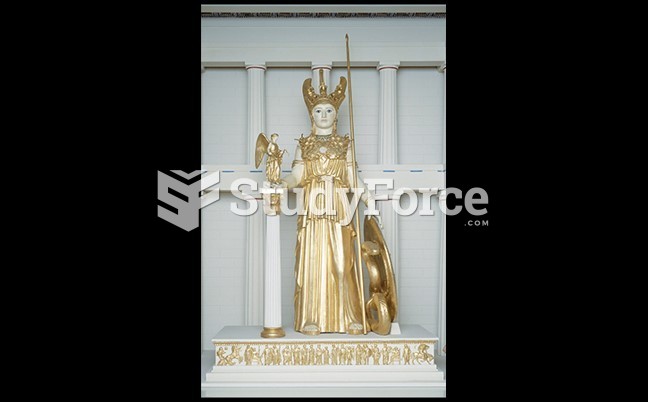 Re-creation of Pheidias’s Huge Gold and Ivory Figure of Athena
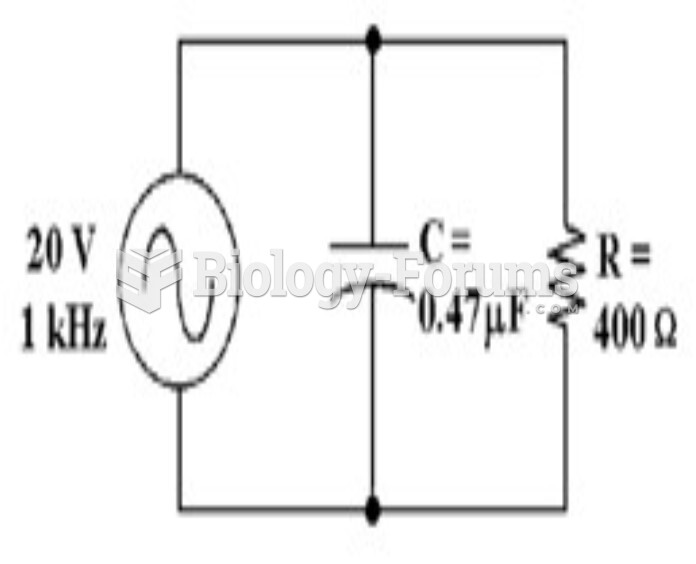 How much voltage does the resistor drop in Figure 10-2? a. 59 mV b. 19.94 V c. 20 V d. 10 V