|
|
|

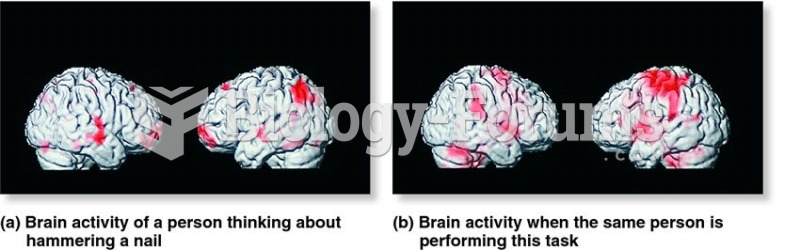 Exploring the functional activity of brain regions by using fMRI scans.
 Localization of a Peptide The peptide is revealed by means of immunocytochemistry. The photomicrogra
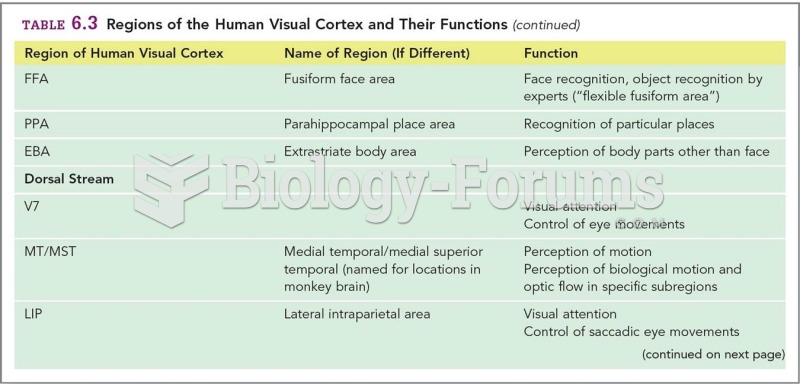 Regions of the Human Visual Cortex and Their Functions
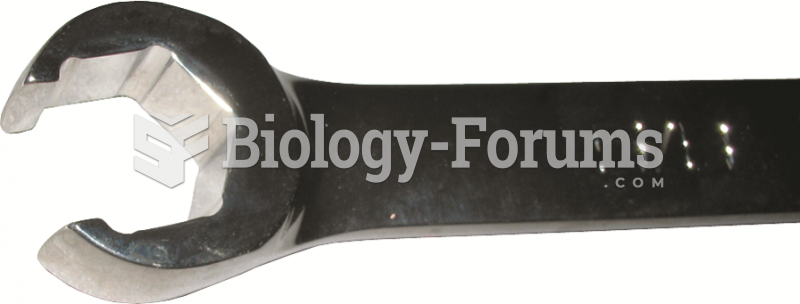 The end of a typical line wrench, which shows that it is capable of grasping most of the head of ...
 Agricultural Regions
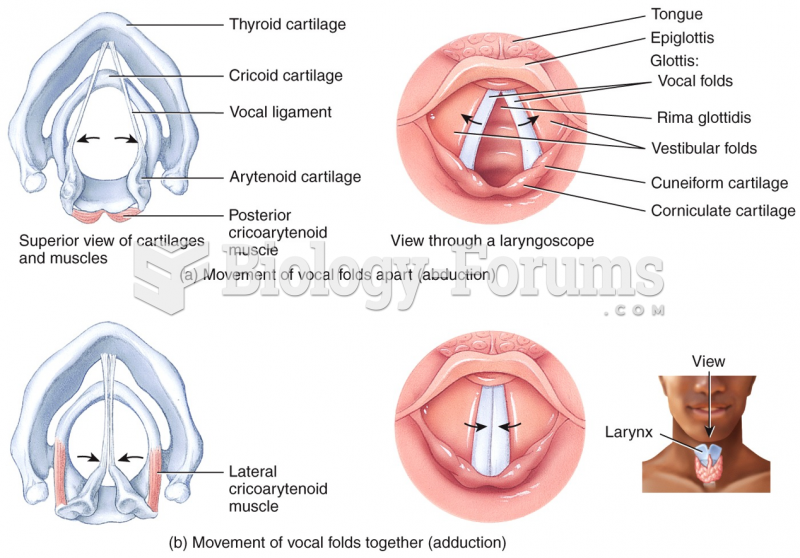 Structures of Voice Production