This topic contains a solution. Click here to go to the answer
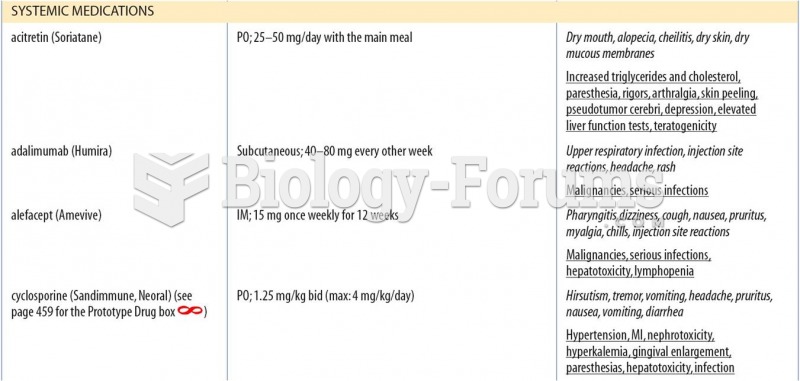
Author Question: A ________ is a graphical method used to help identify how two variables are related. A) trend ... (Read 76 times)

Deast7027

  • Hero Member
  • *****
  • Posts: 538
A ________ is a graphical method used to help identify how two variables are related.
 
  A) trend analysis
  B) ratio analysis
  C) scatter plot
  D) productivity chart

Question 2

Newton Building Supplies hopes to generate an extra 4 million in sales next year. A salesperson traditionally generates 800,000 in sales each year. Using ratio analysis, how many new salespeople should Newton hire?
 
  A) 2
  B) 5
  C) 10
  D) 20


Related Topics

Need homework help now?

Ask unlimited questions for free

Ask a Question
Marked as best answer by a Subject Expert

emsimon14

  • Sr. Member
  • ****
  • Posts: 344
Answer to Question 1

Answer: C

Answer to Question 2

Answer: B


Did you know?

A headache when you wake up in the morning is indicative of sinusitis. Other symptoms of sinusitis can include fever, weakness, tiredness, a cough that may be more severe at night, and a runny nose or nasal congestion.

Did you know?

Interferon was scarce and expensive until 1980, when the interferon gene was inserted into bacteria using recombinant DNA technology, allowing for mass cultivation and purification from bacterial cultures.

Did you know?

Earwax has antimicrobial properties that reduce the viability of bacteria and fungus in the human ear.

Did you know?

Eat fiber! A diet high in fiber can help lower cholesterol levels by as much as 10%.

Did you know?

Approximately 500,000 babies are born each year in the United States to teenage mothers.

For a complete list of videos, visit our video library