This topic contains a solution. Click here to go to the answer
|
|
|

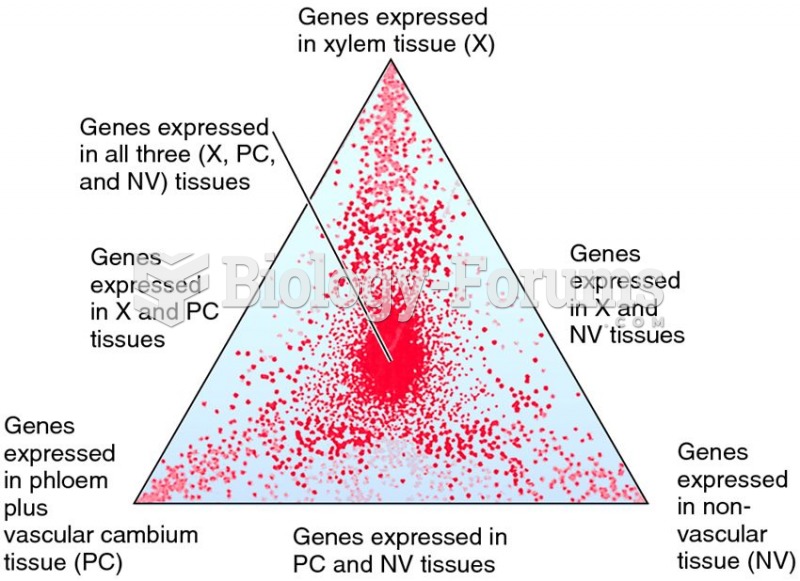 Triangle plot showing gene expression related to xylem, phloem, and nonvascular tissue in Arabidopsi
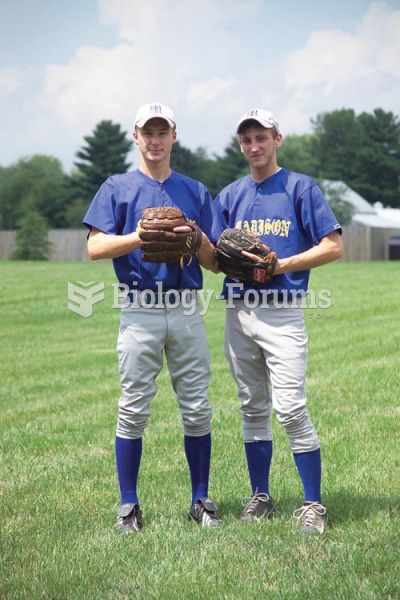 Many hobbies and leisure activities have some risk of health-related injuries
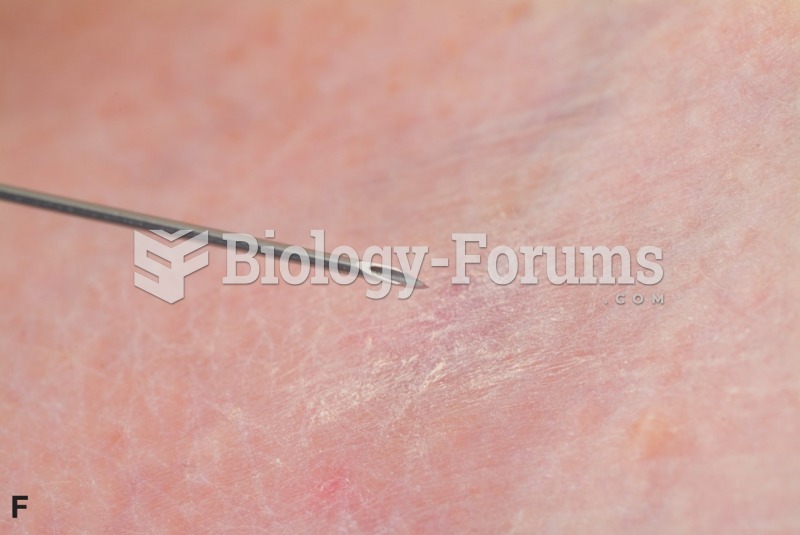 Performing Venipuncture Using the Vacutainer Method
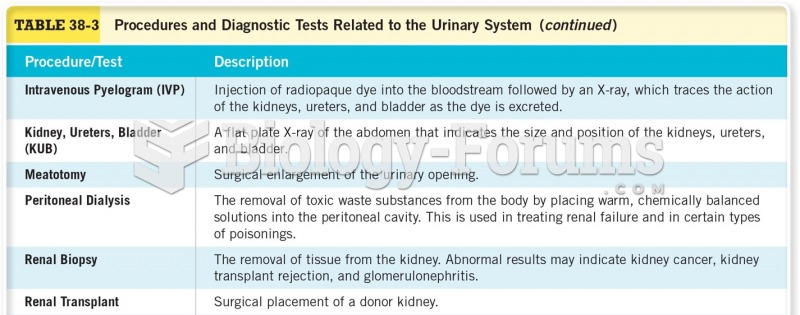 Procedures and Diagnostic Tests Related to the Urinary System
 In-line blending is the most accurate method for blending ethanol with gasoline because computers ...
 Delta method question