This topic contains a solution. Click here to go to the answer
|
|
|

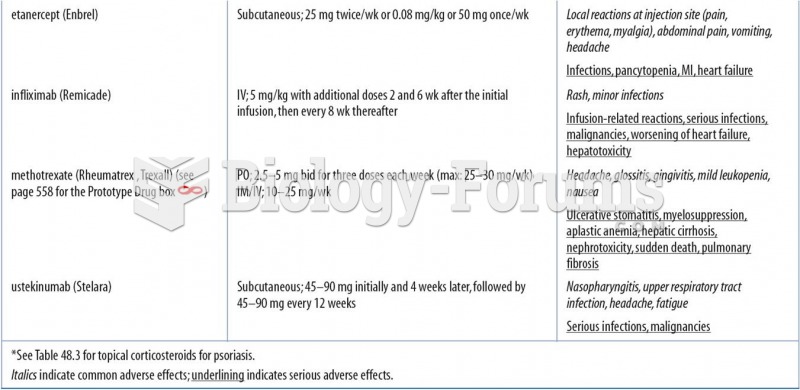 Selected Drugs for Psoriasis and Related Disorders
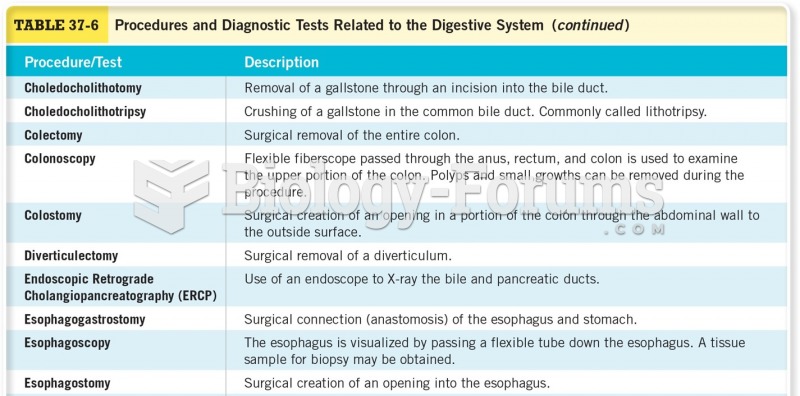 Procedures for Diagnostic Tests Related to the Digestive System
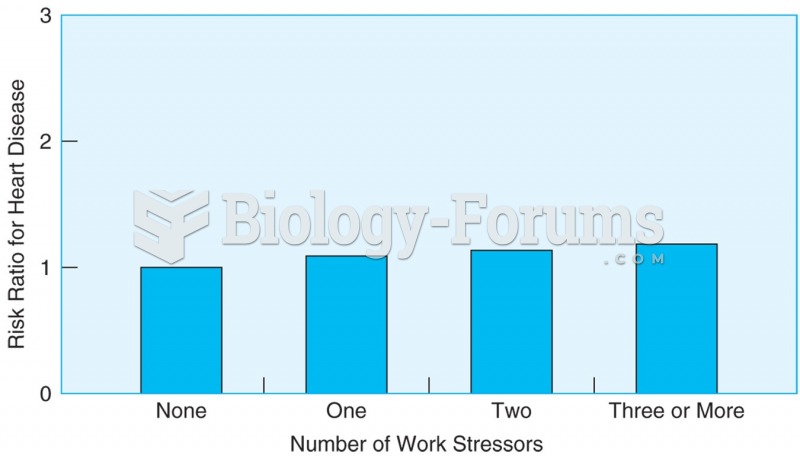 Men who are at risk for heart disease and report work-related stressors are at greater risk of death ...
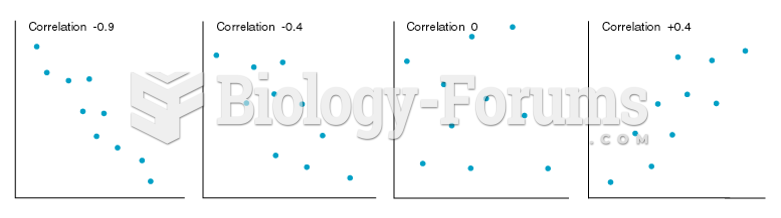 Scatterplots of Variables Having Several Different Levels of Correlation
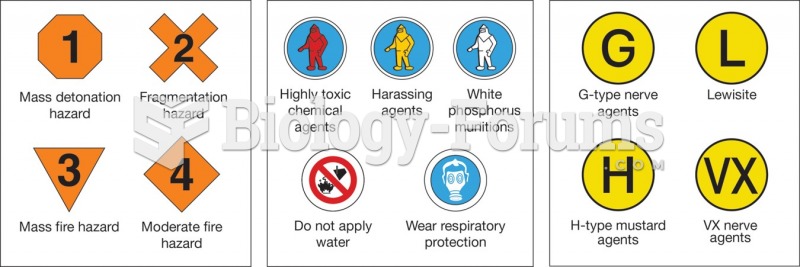 The U.S. military uses its own marking system to identify explosive hazards (left), chemical hazards ...
 Computer-automated DNA sequencing using the chain-termination (Sanger) method