This topic contains a solution. Click here to go to the answer
|
|
|

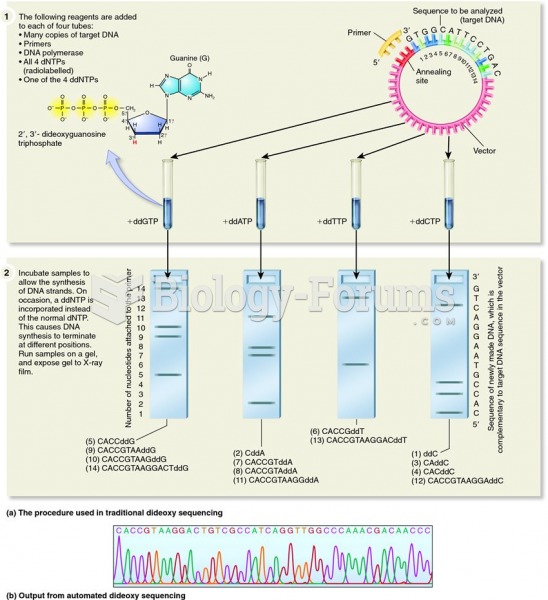 DNA sequencing by the dideoxy method
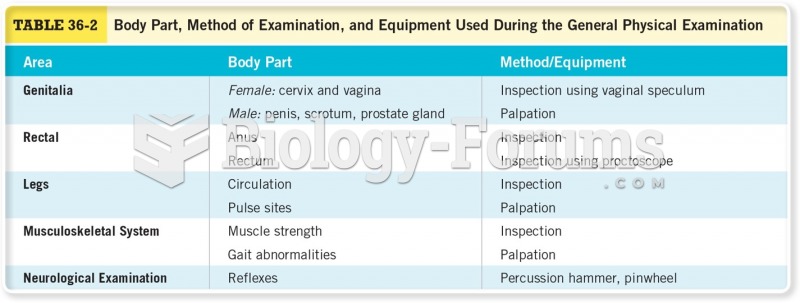 Body Part, Method of Examination, and Equipment Used During the General Physical Examination Cont
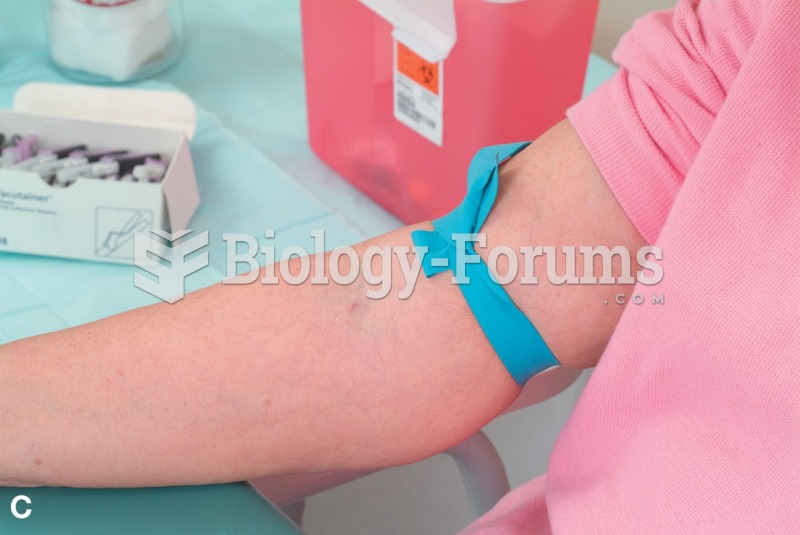 Performing Venipuncture Using the Vacutainer Method
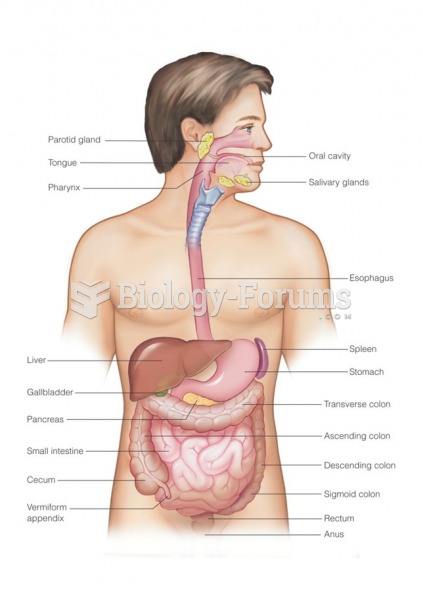 Organs of the alimentary canal and related accessory organs
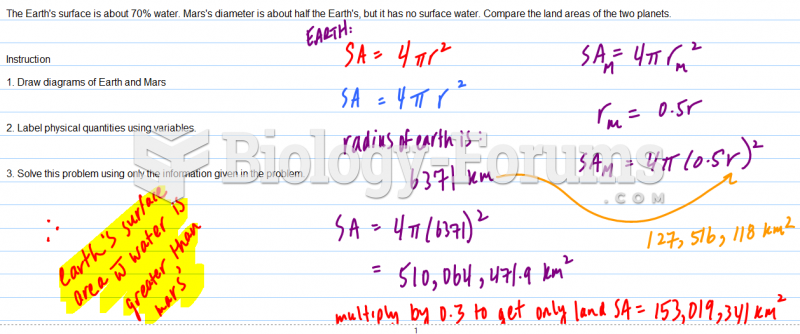 Calculate the physical variables
 Hermann Muller and the Drosophila ClB Chromosome Method