This topic contains a solution. Click here to go to the answer
|
|
|

 Examining the survivorship curve of a Dall mountain sheep population reveals information on the caus
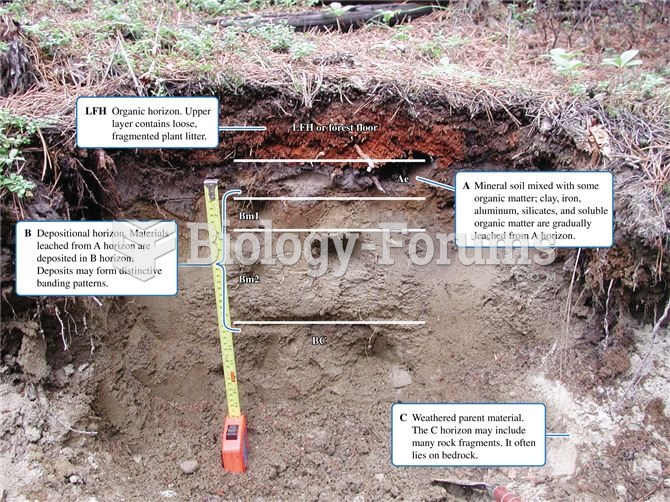 Soil profile exposed in a boreal forest site, showing LFH, A, B, and C horizons.
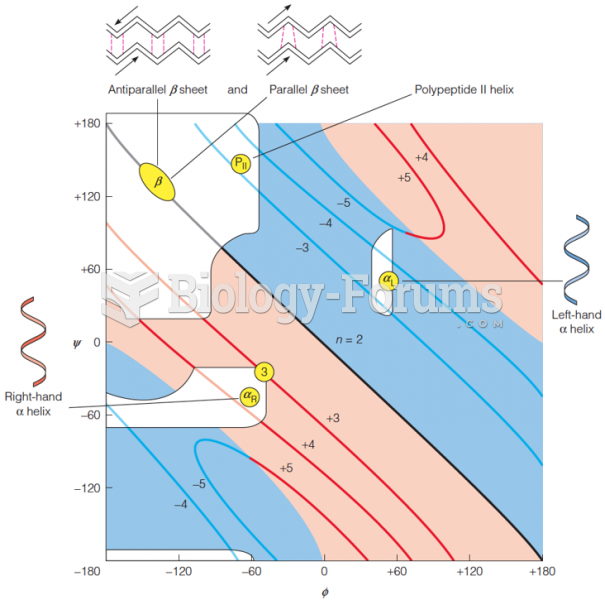 Ramachandran plot
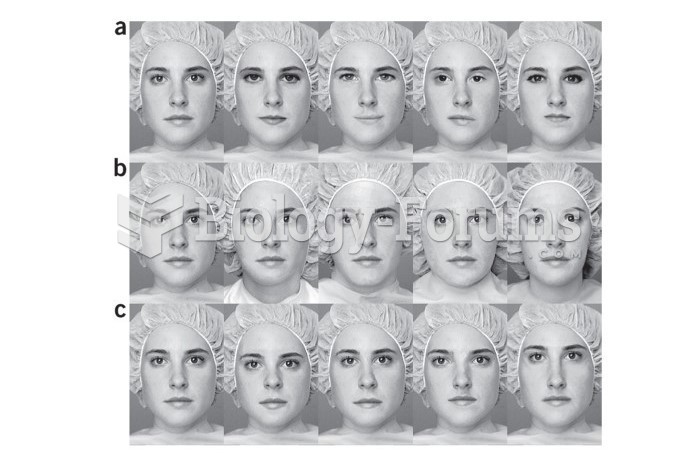 Sensitivity study for facial difference
 Marking for Population Study
 Bayesian Analysis of the Genotype of II-2 in Figure A.4