This topic contains a solution. Click here to go to the answer
|
|
|

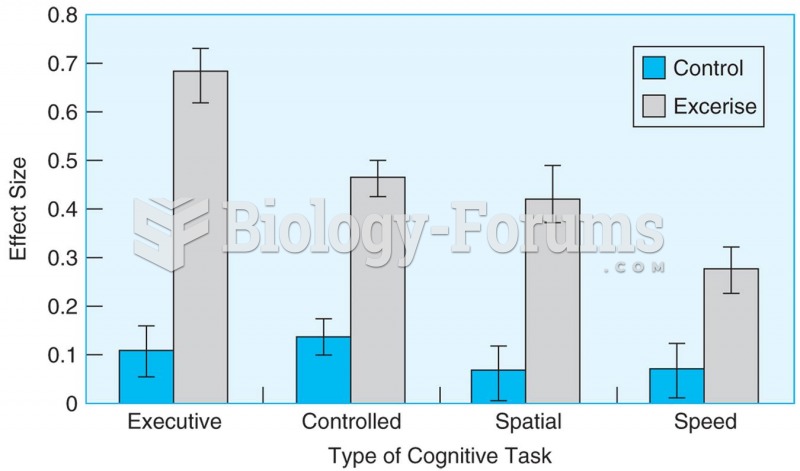 Meta-analysis of 18 studies shows that aerobic exercise causes better performance in older adults on
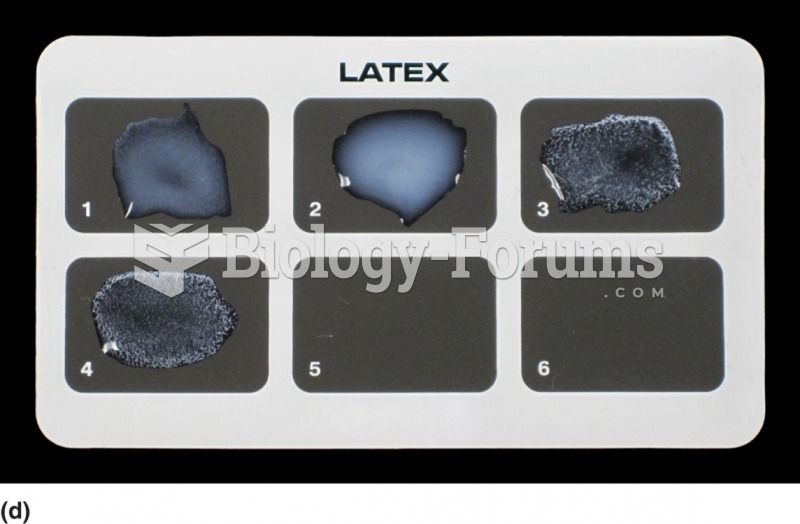 A latex agglutination reaction. This is an analysis for rheumatoid factor. Immunoglobulin is bound ...
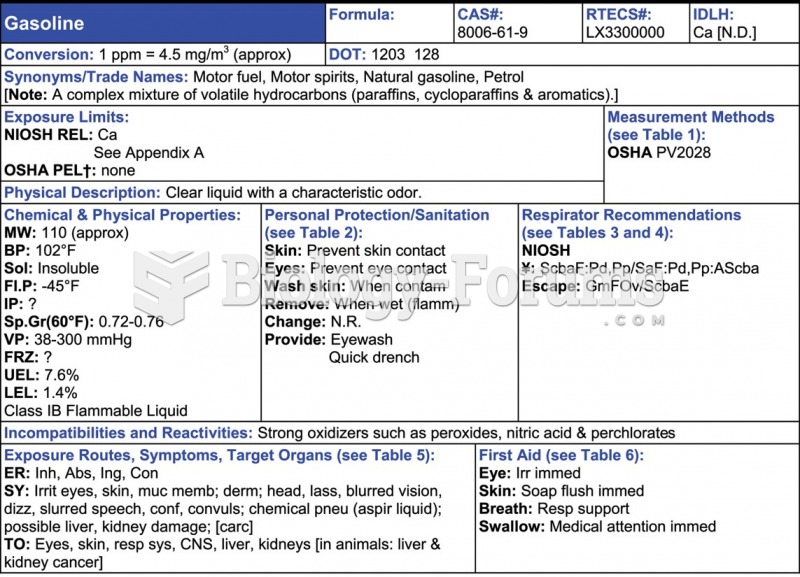 The NIOSH Pocket Guide entry for gasoline. Useful information includes health effects and chemical ...
 The CAMEO entry for chlorine. Useful information includes chemical and physical properties, personal ...
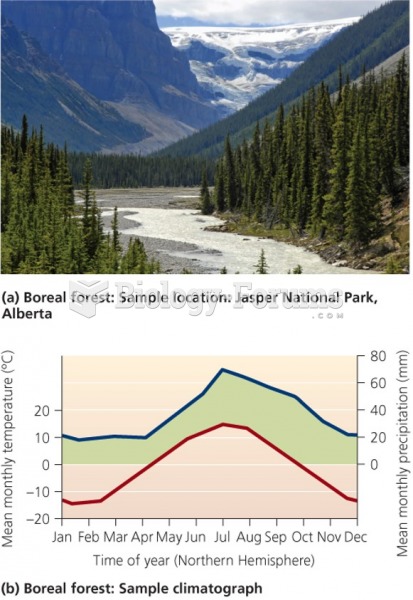 Boreal forest (taiga) "الغابة الشمالية التايغا"
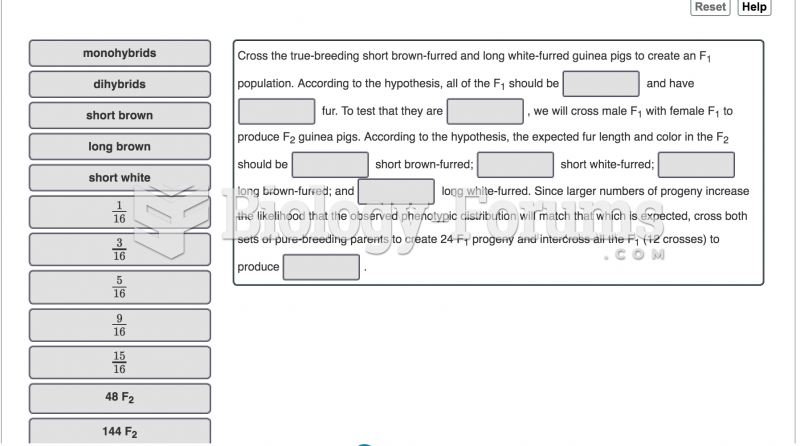 You have four guinea pigs for a genetic study. One male and one female are from a strain that ...