This topic contains a solution. Click here to go to the answer
|
|
|

 Massive amounts of wood are stored on the forest floor of old-growth temperate coniferous forests of
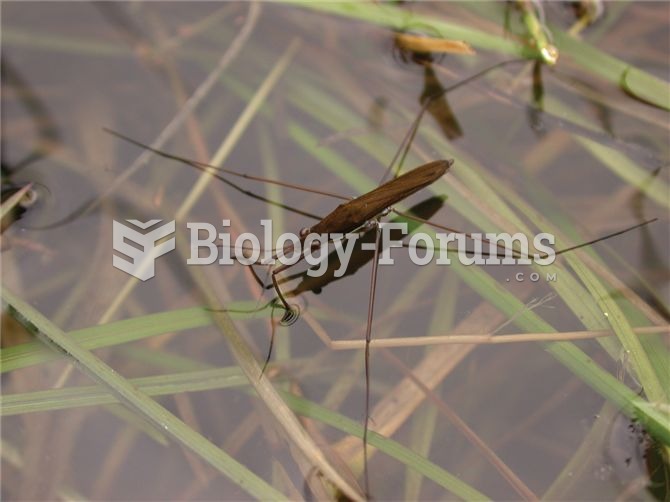 Water striders serve as a model organism for the study of sexual conflict between males and females.
 Discharge summary information
 Using alert labels enables the medical staff to quickly identify important information such as ...
 Surfing the Internet for nutrition information
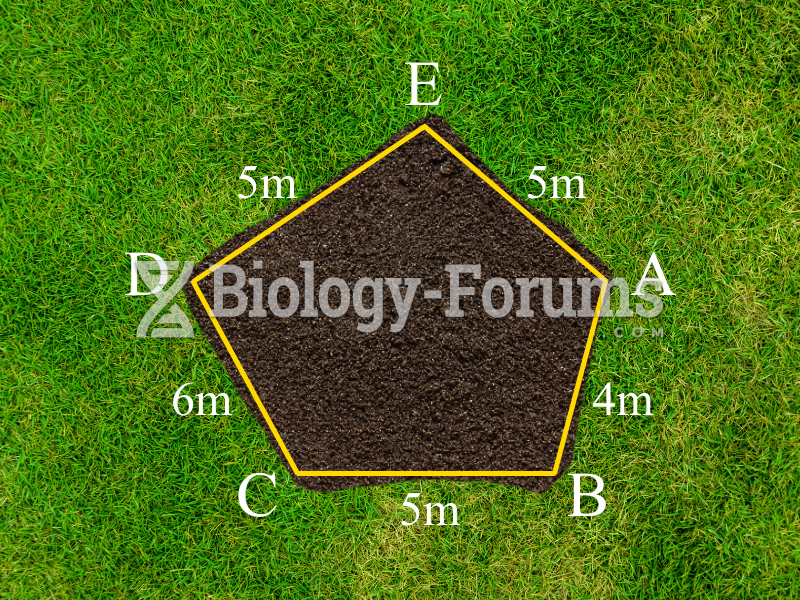 Plot of land (Part b)