This topic contains a solution. Click here to go to the answer
|
|
|

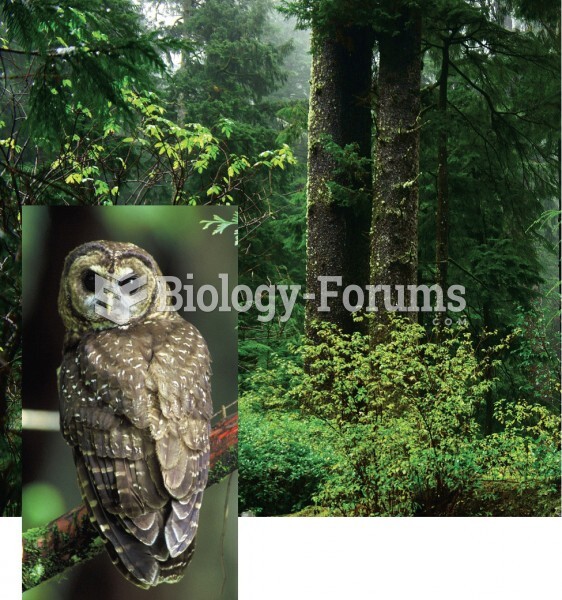
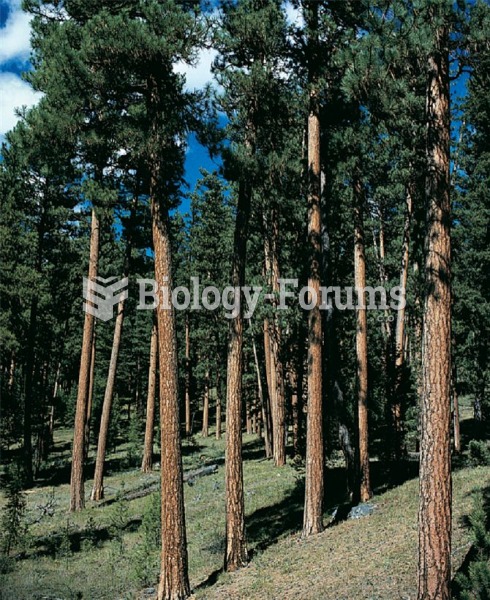 Competition in a forest can be as intense as competition on a coral reef. However, much of the compe
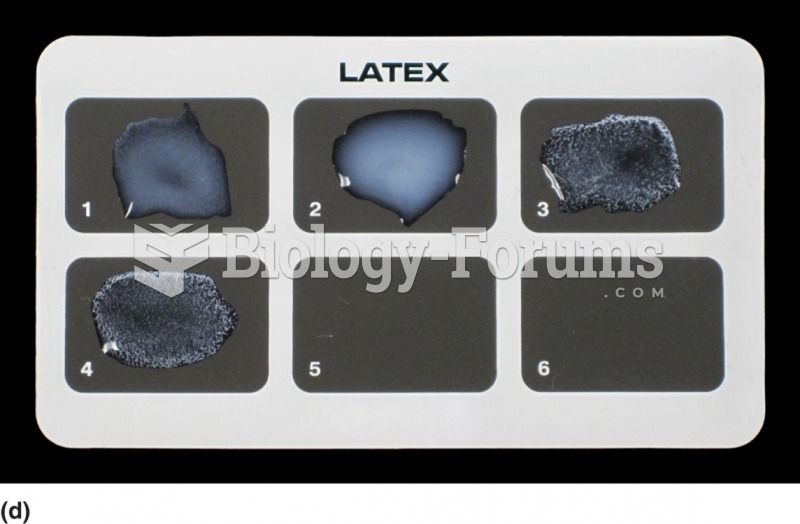 A latex agglutination reaction. This is an analysis for rheumatoid factor. Immunoglobulin is bound ...
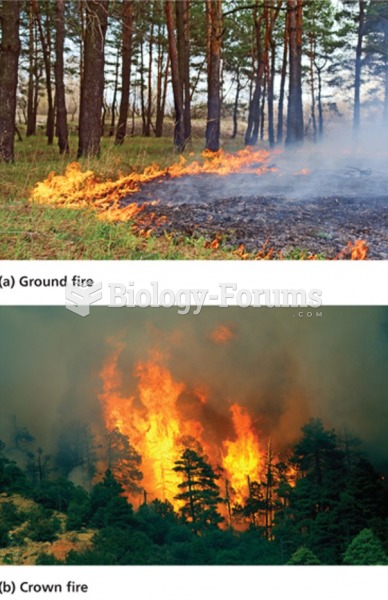 Forest Fire Management
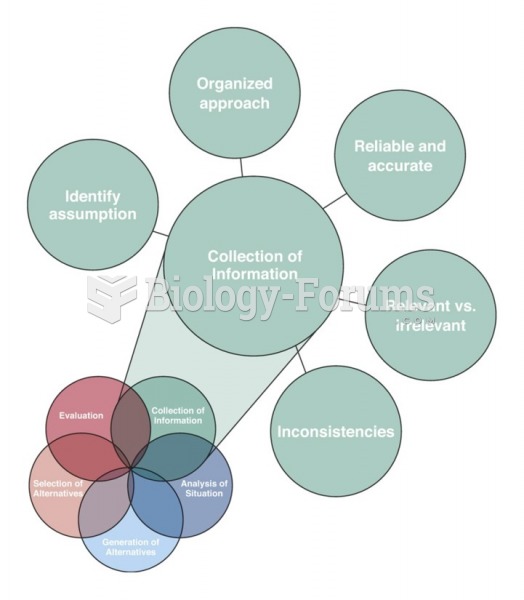 The five skills of the element Collection of Information
 Swot analysis
 Klamath–Siskiyou Forest, a Critical Ecoregion